Is a mini hyperwave forming?
Is a mini hyperwave a thing?
A hyperwave shows a parabolic bubble type rise. It is something I have learned from Tyler and I am sure you have heard of it before.
Normally this is used for macro trend and really long term stuff. And Tyler is using this to come up with his $1000 bitcoin target.
Interestingly bitcoin has been running up in a very crazy parabolic move, ever since we broke away from 4200.
It has taken me by surprise as well as many traders, which was obvious from the large amounts of shorts that were open when bitcoin went up and the very crazy rate of margin calls over the last few days.
To me, the short term move of bitcoin from its bottom to now looks very much like a hyperwave. It is a parabolic unsustainable increase in price, sorta like a mini bubble.
So I am wondering if bitcoin is going through a very short term mini hyperwave.
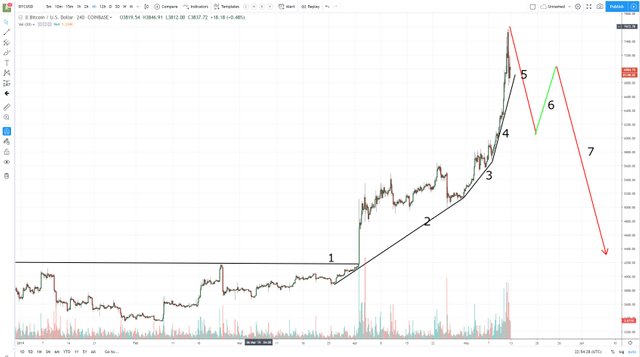
If so we are still in the uptrend of the latest phase and the bubble has not yet burst. But if the price does not form a new high it could look a bit like the chart outlined.
I have no idea if this is a valid thing to draw on a 4h candle chart so wanted to get your input?
If this is the case then a short can be placed as soon as the 4th trend line is broken thru or after the phase 6.
The target would $4200.
I look forward to your input.
Update:
If you are wondering why nobody is getting bounty upvotes, it is because most answers do not answer the question wether a hyper wave can be drawn in the short term.

 |  |  |
|---|

 |  |
|---|
@knircky has set 10.000 STEEM bounty on this post!

Bounties let you earn rewards without the need for Steem Power. Go here to learn how bounties work.
Earn the bounty by commenting what you think the bounty creator wants to know from you.
Find more bounties here and become a bounty hunter.
Happy Rewards Hunting!
Congratulations to the following winner(s) of the bounty!
Find more bounties here and become a bounty hunter.
Find more bounties here and become a bounty hunter.
Find more bounties here and become a bounty hunter.
Find more bounties here and become a bounty hunter.
Find more bounties here and become a bounty hunter.
I don't think there are mini-hyperwaves.
Now that we are siting at 7000$ I think we can go down to 6400$ and then bounce back from the previous long time support. If that happens this is a clear bullish signal that could easily take botcoin to 10000 within a month or two.
Looks like you were right with this chart and analysis. The wave seem to have gotten to the peak of the parabola and taking on the downward trend. I mean Bitcoin is now down to $7.9k and looking bearing after surpassing $8k about 24hrs ago.
The trading voluems are about 50% larger that what BTC had in its bull run towards the ATH. So it certainly was a parabolic move and I'm inclined to agree with your mini-hyperwave theory and the chart prediction is probably a likely scenario.
I don't see any major announcement or development to cause a bull run like this. So it could be short lived. But on the other hand according to https://www.trinsicoin.com BTC mining is highly profitable with only a 4K cost to mine a coin which could make the ecosystem much stronger and help the mining companies.
I think $4200 is a little bit unrealistically low but I just made a post predicting 5200 dollars. I'll be glad to see $4200. i don't think it will positively affect the price of steem however .
That sounds interesting.
I think the current raise in Bitcoin price is somewhat comparable with the last dump in Bitcoin last year.
Would the last dump in Bitcoin also be considered a hyperwave?
I think though for an overall good market structure it would be great to see a healthy correction in Bitcoin and hopefully paired with a massive Altcoin Pump as well.
It does makes sense, like you said... Tyler hyperwave is based on weekly or monthly charts. However you got a good point 😀
I thought btc will concussion between 7000 and 8500 for about 2~3 months, then climb 15% to 10000 points again.
According to the forecast of Chart 1 and Chart 2
Chart 1: These days, price for every 4 hours
Chart 2: These days, price for every 24 hours
Chart 1
I thought btc 會在7000~8500之間震盪整理2~3個月左右,然後再度爬升15%至10000點.
根據走勢圖一和走勢圖二的預測
走勢圖一: 這幾天,每4小時的變化
走勢圖二: 這幾天,每24小時的變化
Chart 2
In general we humans are very good at detecting a signal in noise. Nonetheless, I think this looks interesting and is probably as valid as the original theory.
When making such theories it is always good to be aware about what would invalidate it? We arguably dipped just below the line and now we are above again.
I don't think we're going through a hyper wave, nor just some short "bullish bounce". In 2014, crossing the 55 EMA (blue) on the weekly meant the beginning of the bullish cycle. I think this applies nowadays too: we crossed the 55 EMA with a strong momentum and even went through the 6000 - 7000$ resistance like it wasn't even there.
Well.. I believe (and hope) we're not going below the 6000-7000$ (green rectangle) anymore. Perhaps a correction will happen, but it would be great if we bounce in that area and even interact with the 55 EMA.Ctrl + Click here to enlarge the image in a new tab (steemitimages)
Cheers!
So any ideas why a hyperwave does not work short term?
A lower high & a hyperwave pattern might be possible, but I don't think 4200$ is reachable at the moment. For now I'd say that the 6000$ area is more accessible in case of a heavier correction.