TIB: Today I Bought (and Sold) - An Investors Journal #290 - Corn, South Africa, Semiconductors, Europe, Marijuana
Tech stocks march ahead. Cannabis continues to rock. Buying semiconductors and losing patience with Europe in favour of specific industrials. Bitter lessons from corn trading. Bitcoin finds support with seller exhaustion.

Portfolio News
Market Jitters - Tariff Tantrum US markets pushed higher again on the prospects of US-Canada trade talks
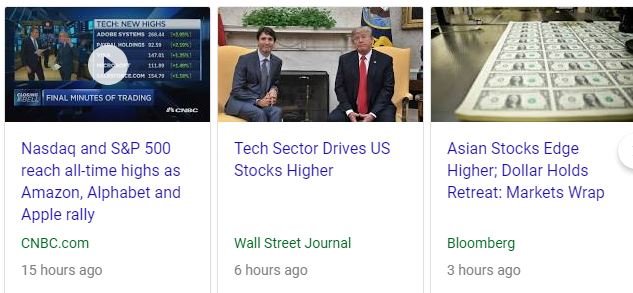
Technology continues to be the driver with Amazon and Apple making all time highs again. A US-Canada trade deal could be signed as early as the end of this round of talks this week. The Canadian Dollar is saying they will agree. The Social Media rant fizzled out with Morgan Stanley uprating Alphabet (GOOGL) and price wiping out the prior day losses.
https://www.cnbc.com/2018/08/29/us-markets-us-canada-trade-talks-in-focus.html
Interest rate markets are underpinned by solid demand in Treasury auction of 7 year bonds.
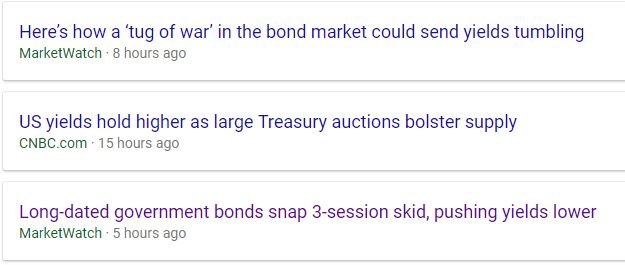
The headlines are confusing - a tug of war, yields hold higher, yields pushing lower in 3 different headlines. The interesting headline is the one about long-dated government bonds. The author is talking about 7 year bonds as being long dated. I thought 10 and 20 and 30 years was long. 7 feels short to me.
US Dollar moves are of interest to me. The US Dollar has been weakening as the mood about trade deals buoys up sentiment to emerging markets.
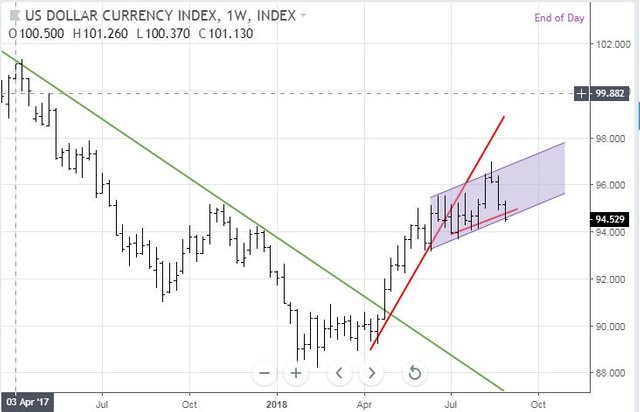
The chart is a weekly chart of the Dollar Index (dominated by Euro). Price had broken the downtrend (green line) and was rising steeply and then settled into a flatter but rising channel. Price has just tipped the bottom of that channel. This price move has pressured all my long US Dollar trades (vs Euro, Swiss Franc, Chinese Renmimbi and South African Rand.)
With rising US rates, this move is counterintuitive but not out of line with what a lot of the talking heads are discussing - many are bearish on the US Dollar. That means they must be bullish on the Euro though I do not hear them saying as much. Of course on a day when the Argentine Peso and the Turkish Lira went under the pump again, add to the strange feeling. The clue will lie in interest rate differentials. Euribor 3 month rates rose a little more than Eurodollar rates - 1 or 2 basis points is all it takes. Japan rates moved too - more about that tomorrow.
Bought
Following the analysis yesterday on semiconductor stocks I added to positions on two of the stocks in the middle of the table. I did not add to Cirrus Logic (CRUS) as this position is already at the size I am getting to on the others.

Cypress Semiconductor Corp (CY): US Semiconductors
Micron Technology, Inc (MU): US Semiconductors
Advanced Micro Devices, Inc (AMD): US Semiconductors. AMD has been the standout chip performer in 2018. The talking heads felt there was more upside especially with the new 10 nano chip. I added a parcel to the semiconductors crew at the same size as the other holdings.
MMJ PhytoTech Limited (MMJ.AX): Medicinal Marijuana. Cannabis stocks continue to motor ahead in US and Canada. Harvest One (HVT.V - black bars) has improved 22% from the lows this month. MMJ Phytotech (orange line) which owns 60% of HVT has only gone up 9%.
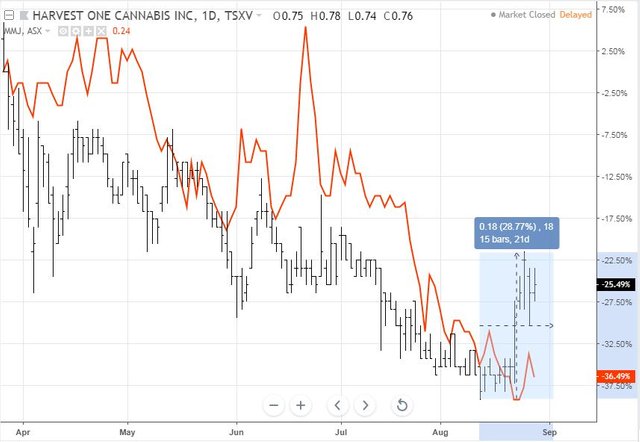
Australian investors have not cottoned onto the idea OR they do not like the other MMJ cannabis investments. Note: there is a currency effect in the chart. The Canadian Dollar has strengthened by 1.3% since the lows last week. That improves the profile of the MMJ investment by 60% of 1.3%.
I added a small parcel to average down my entry price.
Caperpillar Inc (CAT): US Industrials. Caterpillar share price has dropped 23% since the trade dispute erupted. This has brought price all the way back to the weekly uptrend line. With a US-Mexico deal agreed and one lining up for Canada, the trade worries are dissipating to a degree. Price action on the day the Mexico deal was announced is a classic reversal signal with a long tailed low test bar. If price makes it back to the 2017 highs there is a 20% plus move.
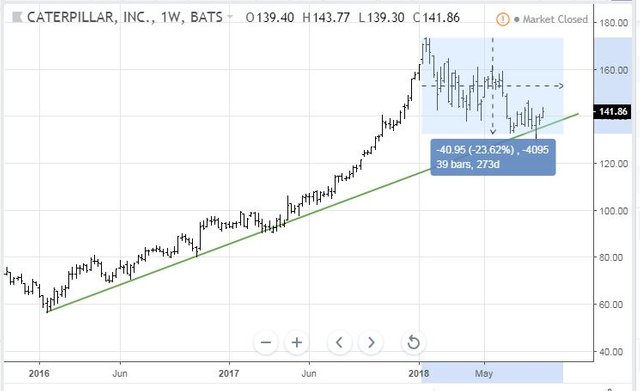
Dividend yield is 2.5%
Corn Futures: I have been invested in corn based on a long term profile for Chinese demand (see TIB245). One of the vehicles I used was an IG Markets futures contract with a September 2018 expiry. I was somewhat taken aback to find a September expiry future rolled to December on the 2nd last day of August - but there you go. The corn trade had started to work well after an impatient entry in June and then fell over pretty well directly when the US Dollar started to weaken. The rollover triggered an 8.7% loss. Short dated futures is not the way to trade this idea especially as one incurs spread costs at each rollover. I have also invested using an ETF (CORN.L) - that will work better over the long haul.
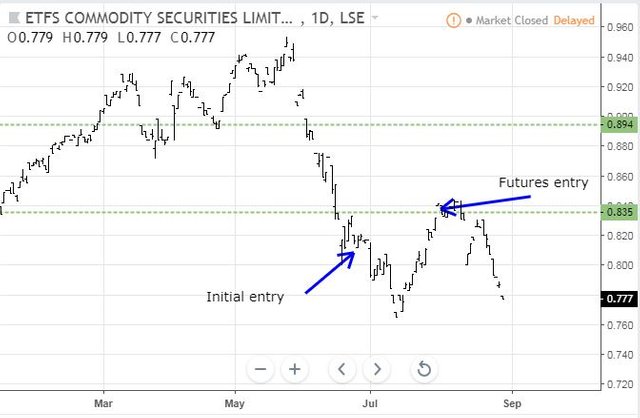
The price chart of CORN.L shows the challenge. The spike up in July is part of a normal seasonal pattern but this one did not run as long as previous years. As the contracts are US Dollar denominated, any US Dollar weakness knocks the price back. All I can hope for is that price makes a reversal and does not make a lower low.
Sold
I did write in TIB289 that I was going to reduce my exposure to European indexes and focus in on specific stocks and maybe countries. I made sales in 3 different stocks in 3 markets in 3 currencies. All these holdings were bought around the same time in 2012 yet the performance results are significantly different. This tells me about currency and market differences.
The Australian Dollar has weakened against all currencies Since December 2012 with 29% vs US Dollar, 25% vs Swiss Franc and 6% vs British Pound (even after Brexit)
Comstage DJ EuroSTOXX 50 ETF (CBSEZz): 42% profit in Swiss Francs since December 2012. This equates to 67% in AUD terms = 11% per year plus dividends
iShares Europe (IMEU.L): 55% profit in British Pounds since November 2012. This equates to 71% in AUD terms
SPDR Stoxx 50 Europe (FEU): 5% profit in US Dollars since November 2012. This equates to 34% in AUD terms
FEU and CBSEZz track the same index and are not currency hedged. IMEU.L tracks a different index. This tells me that investing in Europe from Europe is better than investing in Europe from US markets, currency aside. It was better to be invested in US Dollars than in Swiss Francs with a 6% differential there.
Shorts
iShares South Africa ETF (EZA): South Africa index. South African market has improved with the improving sentiment following the Mexico-US deal. I added to my short position using the same April 2019 56/45 bear put spread. I paid almost the same for the bought leg but received 6% more for the sold leg. This brings down my average breakeven a little. The options chains show that I am alone on the sold leg - my trade added to last weeks' trade is the open interest.
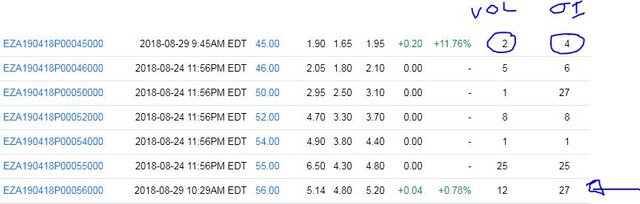
Open interest is low - I am hoping that this grows over the next few months so that there is some volume when it comes time to exit. It is better to have open interest of at least 100 contracts. Best part of the trades has been low brokers fee - 2 or 3 cents total. See TIB287 for the initial trade discussion
Cryptocurency
Bitcoin (BTCUSD): Price range for the day was $234 (3.3% of the high). Price tried to break below the resistance level but there were buyers lurking below $7,000 to help make a close above the resistance line and a new high.
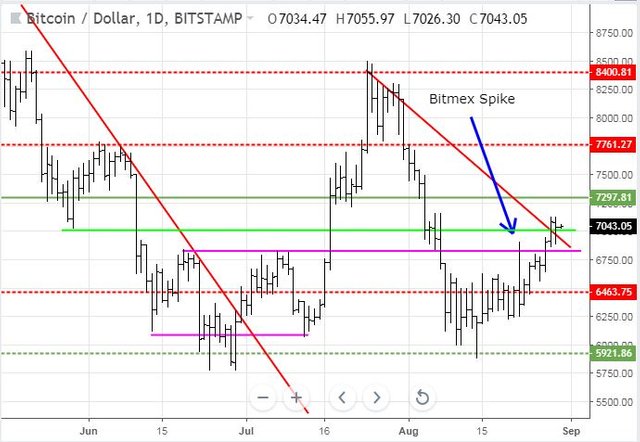
I watched a segment on CNBC with Michael Moro of Genesis Capital talking about what is different this time. His view, which fits with what I have been observing, is that there are fewer sellers around now that the SEC decision on the Bitcoin ETF's has been postponed. CNBC also shared data on volumes and the number of shorts. That data confirms the view that price can now start grinding higher.
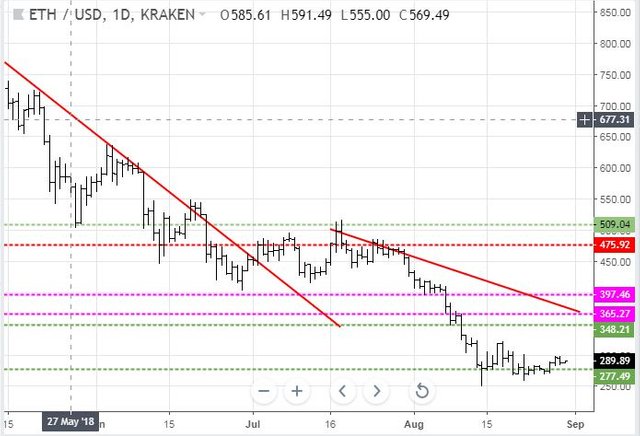
Ethereum (ETHUSD): Price range for the day was $14 (4.7% of the high). Price did not want to break any higher and made train tracks lower but did not make a new low
CryptoBots
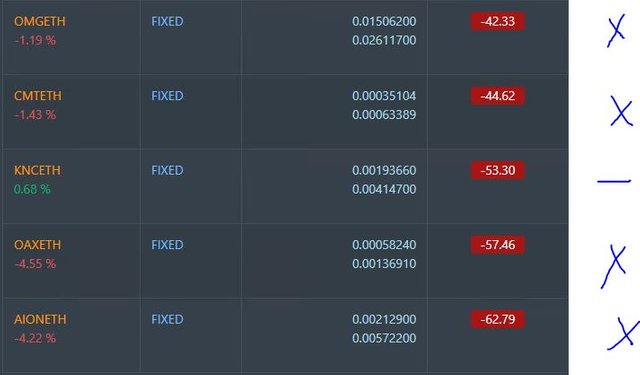
Outsourced Bot No closed trades. ZEC trade could close today. (218 closed trades). Problem children stayed at 18 coins. (>10% down) - ETH (-60%), ZEC (-59%), DASH (-64%), LTC (-48%), BTS (-47%), ICX (-73%), ADA (-62%), PPT (-75%), DGD (-76%), GAS (-80%), SNT (-56%), STRAT (-74%), NEO (-79%), ETC (-48%), QTUM (-73%), BTG (-71%), XMR (-45%), OMG (-61%).
GAS (-80%) dropped back to 80% down and remains the worst. All coins moved up and down in a 1 or 2 point band only - quite surprising on a day that Bitcoin moved 3 percent
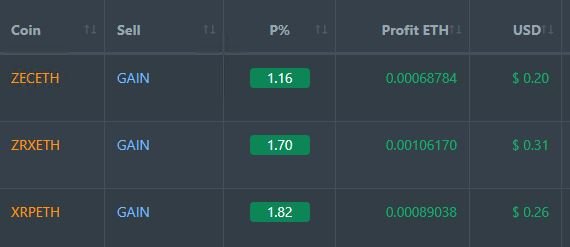
Profit Trailer Bot Three closed trades (1.56% profit) bringing the position on the account to 1.58% profit (was 1.55%) (not accounting for open trades and PT Defender closeouts).
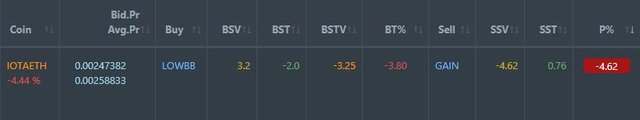
IOTA went onto the Dollar Cost Average (DCA) list. This is a defended trade opened by PT Defender
Pending list drops to 10 coins with EOS closing out and with 3 coins improving, 1 coin trading flat and 6 worse.
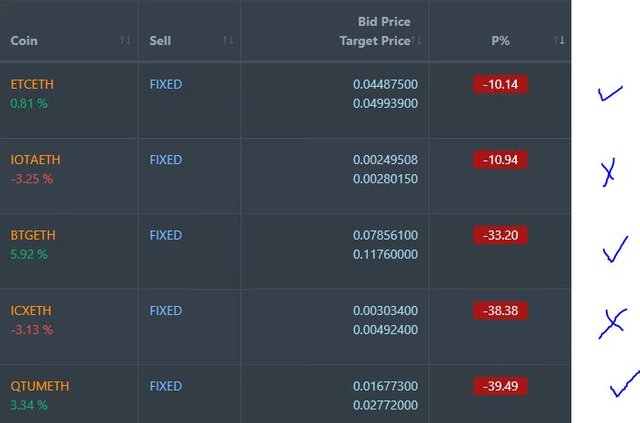
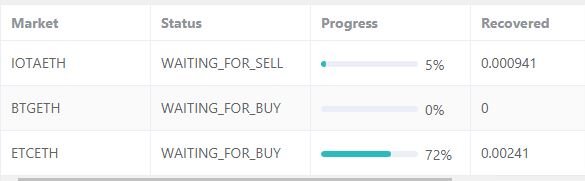
PT Defender completed the defence of EOS and is still working on 3 coins with progress made on ETC. First IOTA defence trade has been made but not closed. I added BTG to the defence. This is a long haul as the position had been DCA'ed 3 times and is quite large.
New Trading Bot Trading out using Crypto Prophecy trial continues. I closed out 4 trades on GTO, POA, RCN and DATA, some against ETH and some against BTC for an average of 1.19% profit. I have been experimenting on using the Bollinger Band screen as a way to identify reversals and then taking half profits at 1.3% and letting trades run for the other half. I now have 4 trades open which do not look like they are going to run anywhere but down.
The LINK trade shows an example of what is happening. Trade entry is where the price is below the lower Bollinger Band. First exit is at 1.3% profit. 2nd exit is looking for price to pass the centre of the bands but above the entry point. This trade is now close to 10% under water.
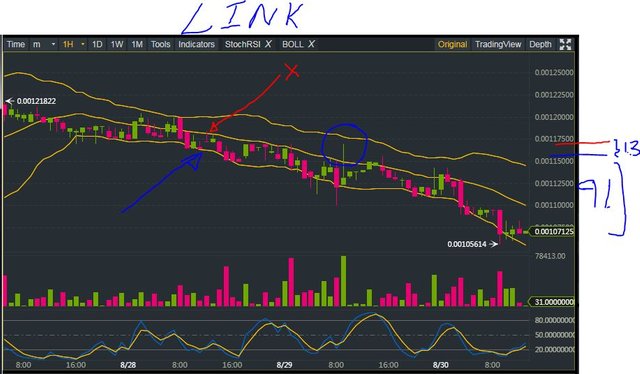
Strategy lesson: If moving average curve is sloping downwards take all the profits at the first target. if the bands are sloping upwards, there is scope to grab some more.
Currency Trades
Forex Robot closed 14 trades (0.54% profit) and is trading at a negative equity level of 14.2% (higher than prior day's 11.9%). A spike in negative equity like this is normal after trades have been closed - but it does feel uncomfortable
Outsourced MAM account A lot more uncomfortable as Actions to Wealth closed out 2 trades for 1.6% losses for the day. New Zealand Dollar had a much stronger day than the Australian Dollar
Cautions: This is not financial advice. You need to consider your own financial position and take your own advice before you follow any of my ideas
Images: I own the rights to use and edit the Buy Sell image. News headlines come from Google Search. All other images are created using my various trading and charting platforms. They are all my own work
Tickers: I monitor my portfolios using Yahoo Finance. The ticker symbols used are mostly Yahoo Finance tickers
Charts: http://mymark.mx/TradingView - this is a free charting package. I have a Pro subscription to get access to real time forex prices
Crypto Trading: get 6 months free trades with Bitmex for leveraged crypto trading. http://mymark.mx/Bitmex
Bitcoin: Get started with mining Bitcoin for as little as $25 http://mymark.mx/Galaxy
August 29, 2018
Osm
an amazing graph I like your post. penetrated
Remarkably the information about carrinm, hopefully marijuana is legally right to get more farmers' income, and the marijuana must be used for the right one.
useful posts thank you for the information @carrinm