TIB: Today I Bought (and Sold) - An Investors Journal #315 - US Paper, Midstream Oil, Europe Airlines, Spanish Telecom, French Consumer Products
Markets bounce after the selloff and gives scope to take profits in Europe Index holdings and redeploy to specific European counters. More bottom fishing in oil and emerging markets small caps.

Portfolio News
Market Jitters - Tariff Tantrum
US markets had a divergent day with the broad based indices (S&P 500 and Dow) going up and specific indices (Nasdaq and Russell 2000) going down.
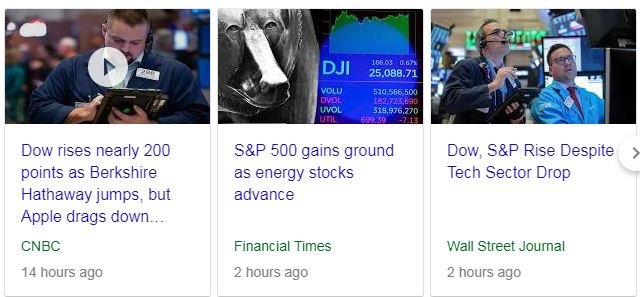
The market has shifted to a stock pickers market with sentiment driving indices all over the place. The market did take some value from China's Xi Jinping speech in which he railed against protectionism and committed to lowering some import tariffs. He also made noise about IP protection but nothing very specific, other than harsher penalities for those caught stealing IP.

The other part of the headline feels like a Freudian slip with Pakistan State TV putting up the word Begging instead of Beijing on a caption while Prime Minster Imran Khan was presenting in Beijing.
Iran Sanctions November 5 was the implementation date for US sanctions on Iran expected mostly to kick up oil prices.
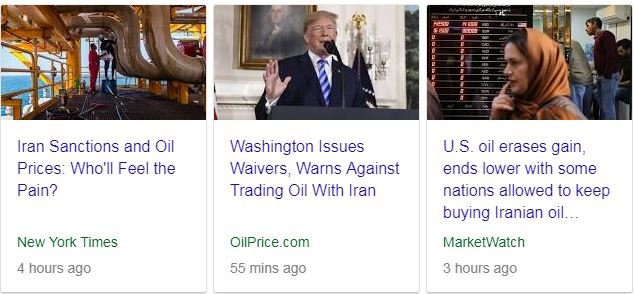
US issued temporary waivers for 8 countries (South Korea, Taiwan, Turkey, Greece, Japan, China, India, Italy) allowing them to buy Iranian oil => oil prices did not kick up. This whole area is more complex than meets the eye with Russia committed to taking Iranian oil and reselling and all Iranian oil tankers turning off their geolocation devices. Is Iran the real enemy or is it Russia?
Bought
Market selloffs are a good moment to explore beaten up stocks which are showing signs of life. I ran my stock screens for Europe. I made a video to capture the broad thinking
Basic premise is Europe is lagging behind US markets. With the US reaching the limits of its market growth, the case for Europe gets stronger - provided of course Europe Muddles does not get in the way again between the ECB, Italy, Brexit, Catalonia or some other muddling mess.
3 screens deployed looking for stocks which have made a one month high (i.e., bounced from the selloff)
- Price to Book Valuation less than 1
- Price to Sales less than 2
- Price Earnings less than 15.
Screens popped up 4 stocks that caught my eye. Carrefour (CO.PA), the French supermarket business I already hold. Its charts look fine if you want to explore it more. So I bought the other three.
Air France-KLM SA (AF.PA): Europe Airline. I like the chart - broken the downtrend, retested and broken back up to make a new high when Europe was not.
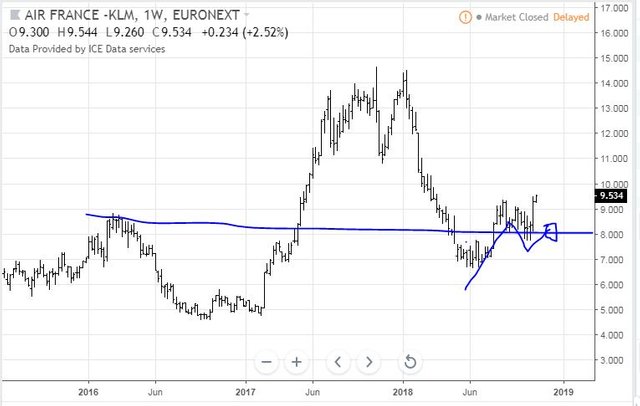
I did make a quick check to see how Air France compared with US Airlines using its OTC ADR's (AFLYY) and was surprised to see it outperforming both Delta and American. That gives me some clues that things in Europe are not as bad as the markets suggest.
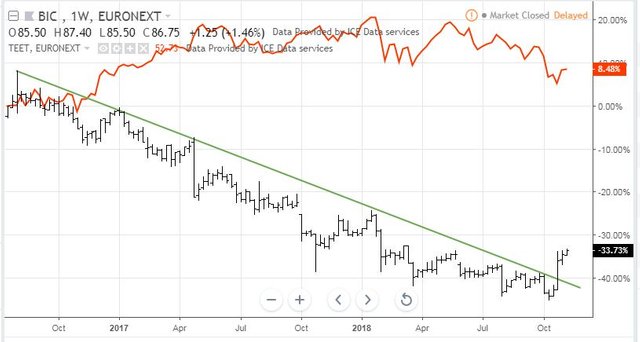
Société BIC SA (BB.PA): French Consumer Products. Dividend yield 4.03%, solid margins and great return on equity and low debt loading. I like the way the chart has broken the downtrend since the start of 2018.
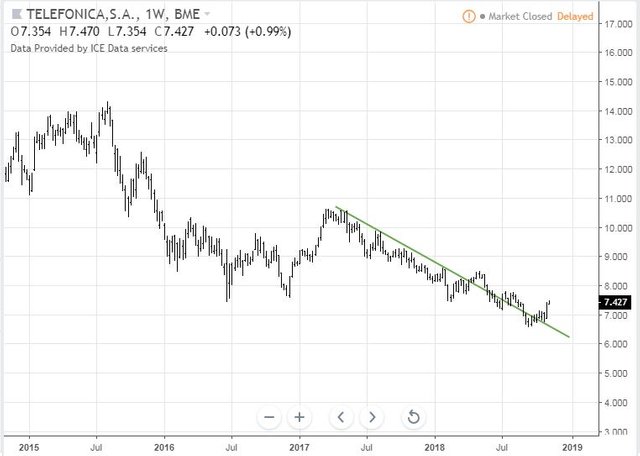
Telefónica, S.A. (TEF.MC): Spanish Telecom. Great margins and returns but worrying debt levels and exposure to Latin America might not be a plus if Brazil and Argentina turnarounds do not flow well. The chart does show a classic beaten up stock that is showing signs of life - provided it can outlast that debt burden when European interest rates begin to rise harder than they have done.
Alerian MLP ETF (AMLP): US Midstream Oil. Oil stocks have taken a bashing during the selloff with oil prices not holding onto earlier gains. Added another small holding in one portfolio to average down my entry price. Disappointed to hear Jim Cramer talk in his daily rundown that he was not comfortable with adding oil right now (i.e, this week) after he had added to his holdings in Anadarko (APC) and BP (BP.L) in the last 10 days or so.
WestRock Company (WRK): US Paper Manufacturer. WestRock announced earnings today that were somewhat mixed with the hurricane damage to their Panama City paper mill bigger than expected but with numbers from their Kapstone acquisition on West Coast somewhat quieter than markets expected. I like the way the chart has bounced and held even with the earnings disappointment.
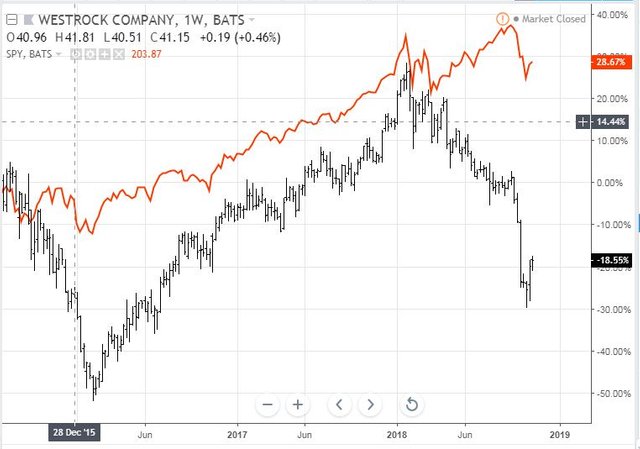
This is a Jim Cramer idea - he likes the way the Kapstone acquisition connects the business more strongly to West Coast customers and to the move away from plastic. To me, the chart of WestRock (black bars) compared to the market (S&P 500 - orange line) tells a story of the US markets focused on growth technology stocks during 2018 and deserting the engine room companies like WestRock. Close half the gap and there is a 20% return right there. Dividend yield of 4.07% and strong cash flows adds to the appeal.
SPDR S&P Emerging Markets Small Cap ETF (EWX): Emerging Markets Index. With the China statements from Xi Jinping, I am expecting to see a bounce in Emerging Markets - small caps is one way to play these bounces. With 10% off the levels I purchased at, this felt like a good level to average down. The chart looks almost identical to WestRock above - a 2018 slide after tracking the S&P500 from 2016.
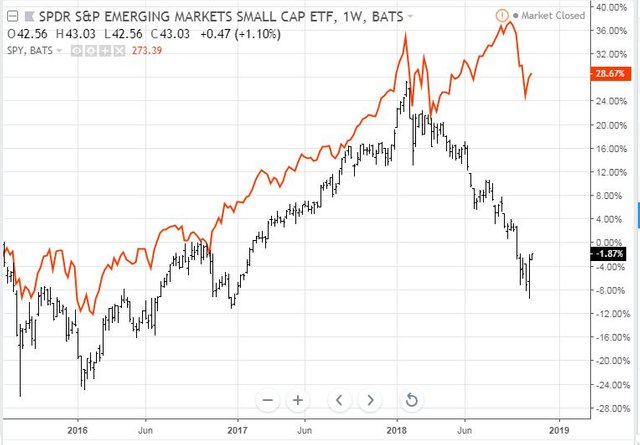
I find it hard to believe that Emerging Markets small caps are 30% worse than US large caps.
Sold
Think European Equity UCITS ETF (TEET.AS): Europe Index. As the market moves into stock picker mode, I am progressively reducing my exposure to index investments. Closed this one out for 11% profit since April 2016. I have had a sell order sitting on the 52 week high on this for ages = ran out of patience and deployed the funds in the European stocks listed above.
Cryptocurency
Bitcoin (BTCUSD): Price range for the day was $72 (1.1% of the high). No surprises here as price rejected the resistance at $6450 and traded lower.
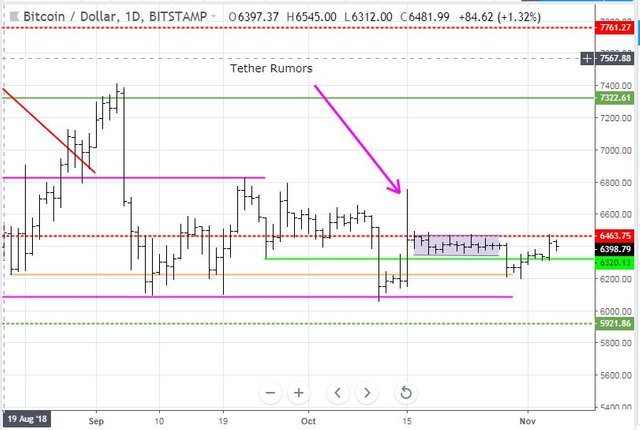
The question will be which support line it stops at - green or brown? Momentum is building with MACD signal line crossing above the slow line and I am going to guess green. I do not predict prices - I make guesses.
Ethereum (ETHUSD): Price range for the day was $4 (1.9% of the high). Price pulled back from the prior day's heady heights and had a quiet drift in "no mans land".
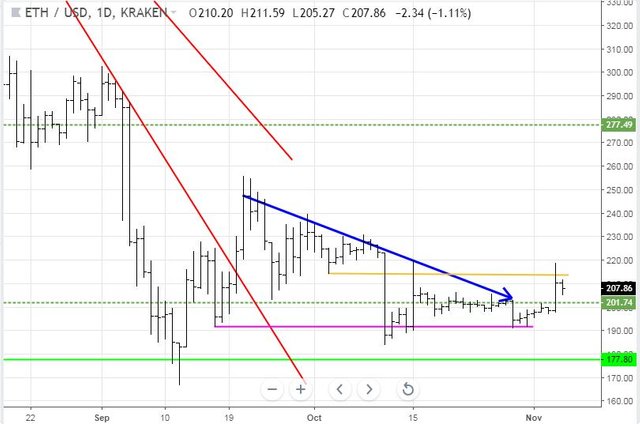
The $200 support zone looks like a likely resting place before the market decides. There is not a lot of price resistance above current levels - maybe the brown ray or the Tether rumour high of $220.
CryptoBots
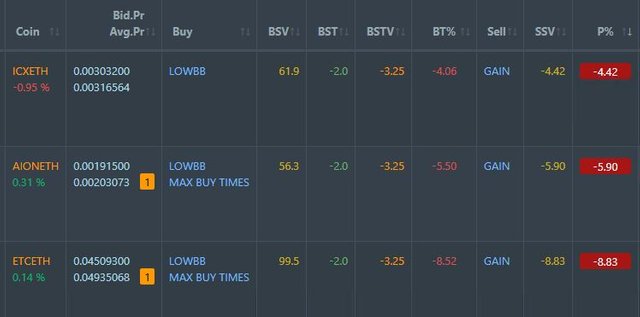
Outsourced Bot No closed trades. (221 closed trades). Problem children stayed at 18 coins. (>10% down) - ETH (-68%), ZEC (-64%), DASH (-65%), LTC (-50%), BTS (-53%), ICX (-79%), ADA (-70%), PPT (-79%), DGD (-80%), GAS (-84%), SNT (-58%), STRAT (-72%), NEO (-81%), ETC (-59%), QTUM (-77%), BTG (-72%), XMR (-36%), OMG (-67%).
Coins drifted in a 1 point band mostly down. GAS (-84%) remains the worst coin a point lower.
Profit Trailer Bot No closed trades.
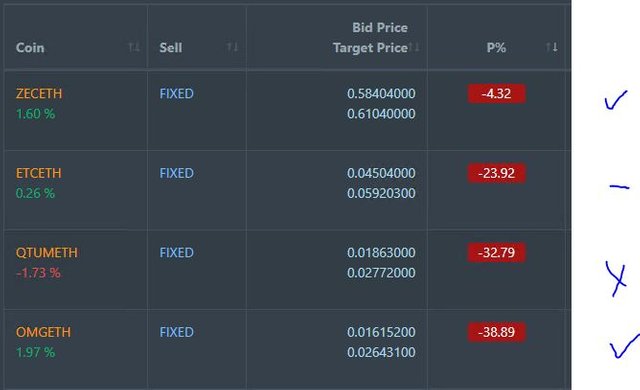
There remain 3 coins on the Dollar Cost Average (DCA) list with TRX moving off and replaced by ICX. TRX has not closed. Challenging trade is AION as it is 4 times larger than the other trades.
Pending list remains at 7 coins with 2 coins improving, 2 coins trading flat and 3 worse.
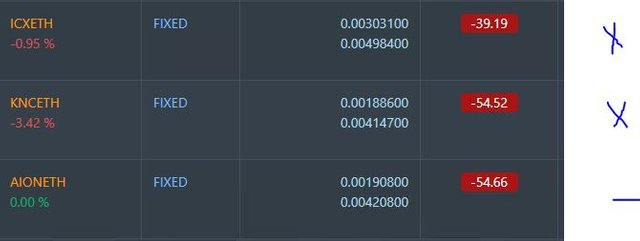
PT Defender continues defending 5 coins with no changes.
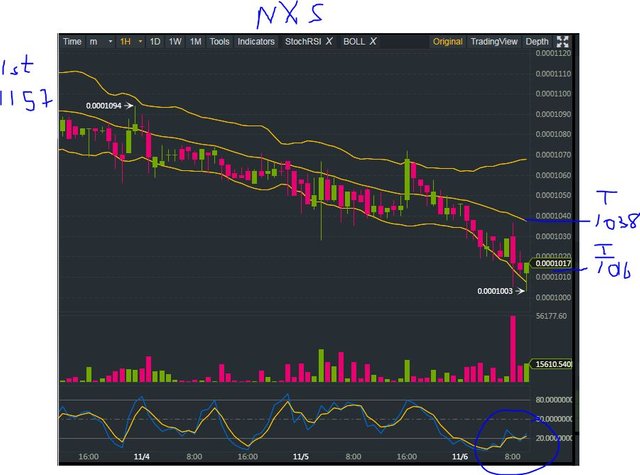
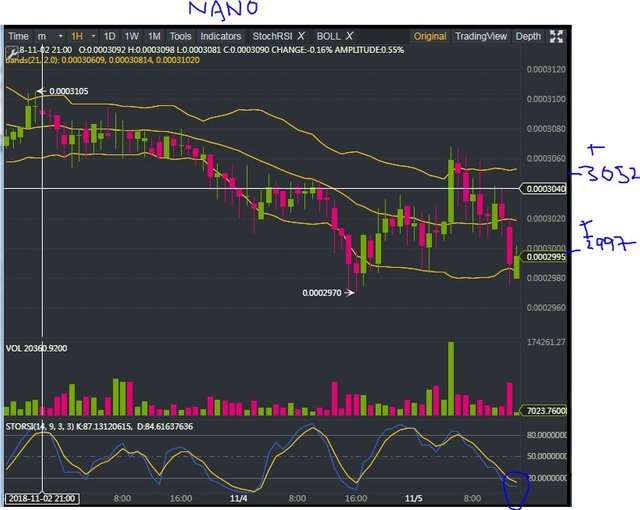
New Trading Bot Trading out using Crypto Prophecy. New trades set up with NANO closing (1.84%). Trades currently open on PIVX, ONT and NXS.
NXZ trade has been open a few days and is looking sick with a chart aimed for lower right hand corner for days now. I added in a DCA trade for half the volume - here is the new chart
NANO trade was textbook.
ONT trade less so with an impatient entry
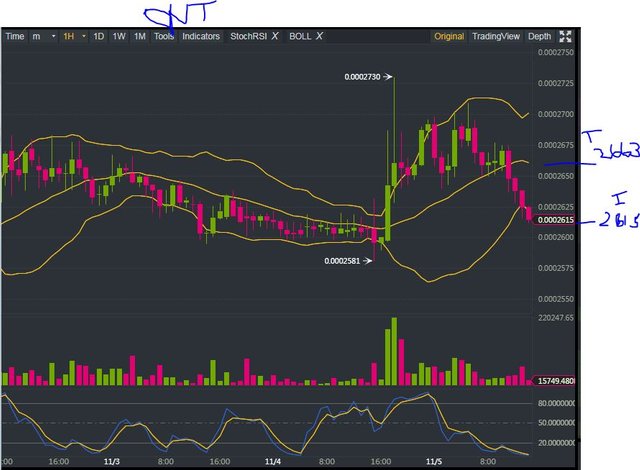
It would have been better to wait a few hours and enter at a lower level and with a target closer to where the top of the bands had been tracking (rather than above them) - like here
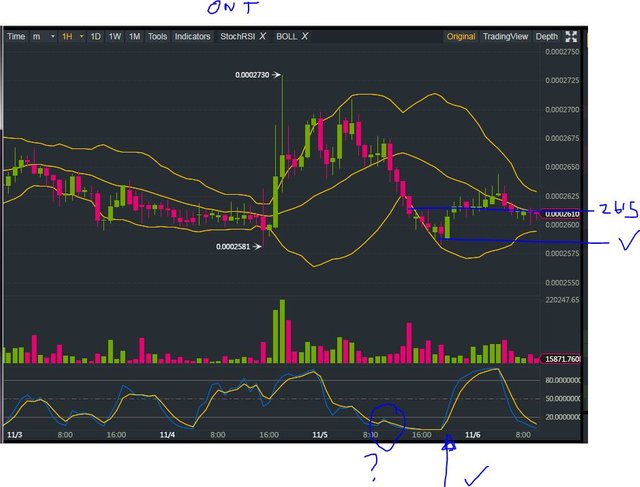
The shape of the chart is better than the NXS chart with price trading sideways in a big band rather than progressively lower.
Currency Trades
Forex Robot did not close any trades and is trading at a negative equity level of 6.3% (lower than prior day's 8.0%). Of note is 82% of the negative equity is swap cost. This could be a good time for the robot to close a bunch of trades to reduce the swap cost and bank profits. This tells me that there has been a massive shift in the currency markets over the last week or so.
Cautions: This is not financial advice. You need to consider your own financial position and take your own advice before you follow any of my ideas
Images: I own the rights to use and edit the Buy Sell image. News headlines come from Google Search. All other images are created using my various trading and charting platforms. They are all my own work
Tickers: I monitor my portfolios using Yahoo Finance. The ticker symbols used are Yahoo Finance tickers
Charts: http://mymark.mx/TradingView - this is a free charting package. I have a Pro subscription to get access to real time forex prices
Crypto Prophecy provides a useful tool to identify oversold and overbought coins - https://mymark.mx/CryptoProphecy
November 5, 2018
Great video! It helps visualize your approach. I wonder if some shorting on the US Market side could also help fill the gap? Potentially running screening on metrics that represent overvalued companies? Thanks for sharing!
Thanks. I do have screens that do that. Price to Book greater than 5. Price to Sales greater than 5. Price to Earnings greater than 30. The challenging part is choosing the techncial indicator as invariably a 30 day low on price is already too late. I do test with a stacking and crossing over of moving averages but not yet found the right mix
My data view is telling me it might be too early hence I have only put hedge trades in on gold mining and at index level via put spreads on SPY and QQQ.