TIB: Today I Bought (and Sold) - An Investors Journal #359 - Australian Dollar, US Pharmaceuticals, Insurance
Growth fears dominated the market. Brexit weighs on UK markets. Germany weighs on Europe markets. Feels like sidelines time. Trade action is in pharmaceuticals and in insurance and a late update on Australian Dollar trade from two days back

Portfolio News
Market Jitters Return
US markets got nervous about global growth and traded down for a 2nd day.
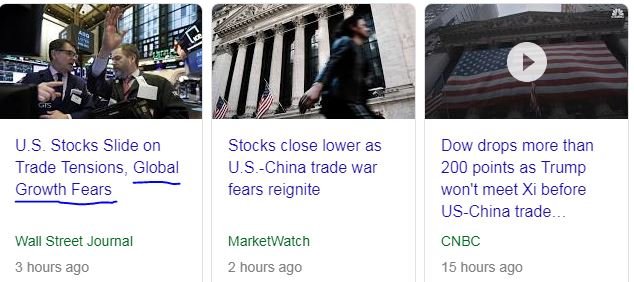
It is always hard to pin down what the drivers of a move really are. Headline writers liked this one and stretched it out into a trade war reignited story. Donald Trump had said that he and China Premier, Xi Jinping would approve the negotiated trade deal. He announces today that they will not be meeting before the March 1 deadline. Markets assume the deal will not be done in time. Well that may not be right. A deal could be agreed. They could agree to push the date further out if talks are progressing well. Who knows?
This one is probably much more important. It certainly is for my portfolios.
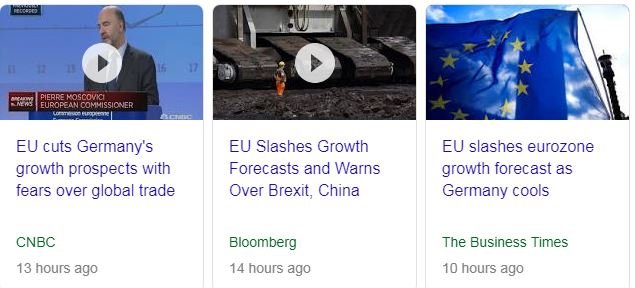
The real problem is the European economy is much more open to global trade than the US. Germany growth is slowing with 1.5% GDP growth announced for 2018 compared to 2.2% the year before, the lowest rate in 5 years.
Brexit Bumbles
Europe story is not helped by the Brexit story. Bank of England revised its forecast down for UK growth
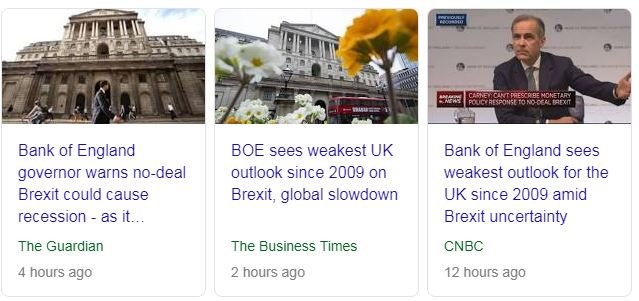
The BOE sharply downgraded its 2019 economic outlook to 1.2 percent on Thursday. As recently as November, the Bank had projected growth of 1.7 percent this year.
https://www.cnbc.com/2019/02/07/bank-of-england-interest-rate-decision-amid-brexit-uncertainty.html
And Theresa May gets rebuffed in her visit to Brussels.
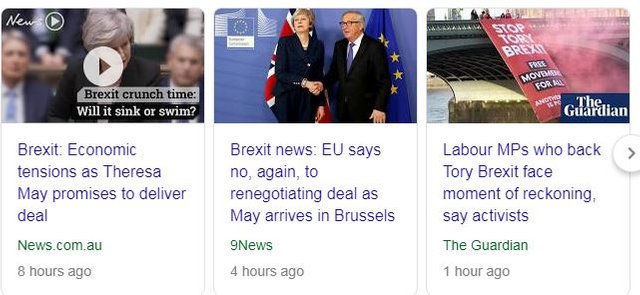
She told them she could get a vote approved in UK Parliament if the EU would agree some legally binding changes. They said "Non Madame" She says talks are continuing.
I read around the spat around commentary made by Donald Tusk right in the middle of negotiations about the Brexit campaigners deserving a "special place in hell" . This level of arrogance suggests to me that the chances of getting a deal are very low. He certainly made Commission Preident, Jean-Claude Juncker's day a whole lot harder. "Hell" said Juncker.
Sammy Wilson, Brexit spokesman for the Democratic Unionist Party, called Tusk a "devilish, trident-wielding, euro maniac."
Bought
Amgen Inc (AMGN): US Pharmaceuticals. Jim Cramer used a down day to add back his recent sale of Amgen. I had not sold when he did as my holding was much smaller than his. I added another small parcel. The chart tells of price finding a level of support 3 times since the market selloff began.
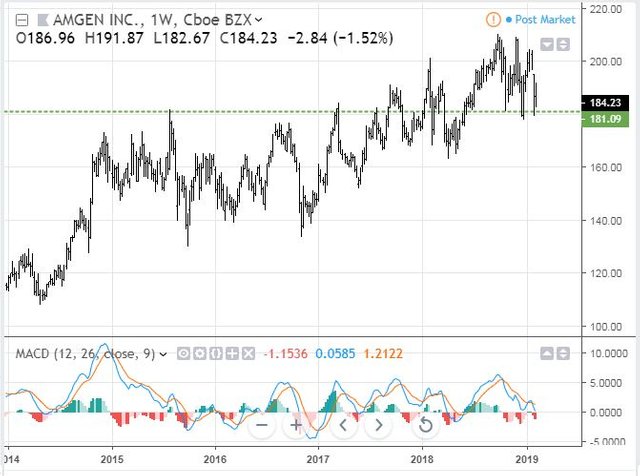
The momentum indicator (MACD - lower window ) is a bit worrying as it is about to enter negative territory.
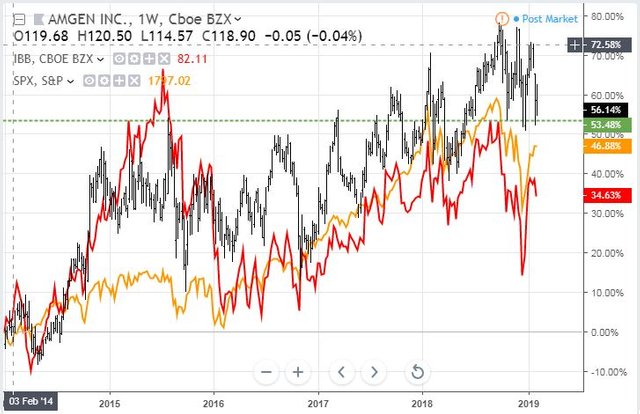
Now the talking heads have been looking to biotechnology on and off through the rally with the iShares Biotechnology ETF (IBB) up 22% from its December lows. The sector is challenging as performance is so dependent on the way clinical trials run and the way regulators respond. Mostly the talking heads land up suggesting buying a sector ETF to eliminate the company specific risk. So the next chart puts Amgen (black bars) against the IBB ETF (red line) and also the S&P500. Over 5 years, the sector has underperformed the S&P500 and Amgen has outperformed both. It has not alwasy been this way. I might have picked a winner (thanks Jim Cramer). What is notable too is Amgen did not fall as hard as the sector in the last selloff.
The next chart adds in another way of looking at things. The blue line is the equal weighted First Trust Amex Biotechnology ETF (FBT - blue line). IBB (red line) is market capitalisation weighted.
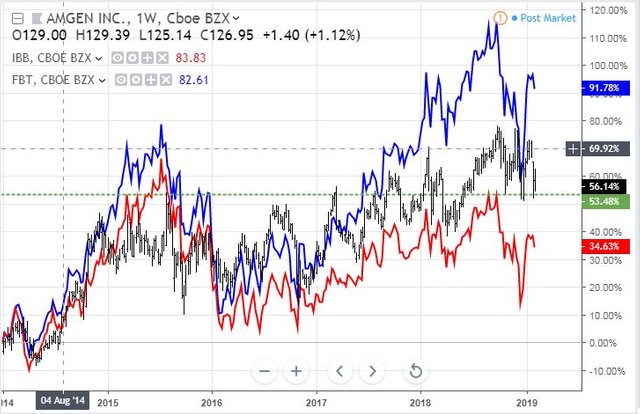
The equal weighted ETF, which has only 31 stocks, has outperformed progressively, especially since the 2016 pullback ended in Q4 2016. What accounts for the difference? US/non US coverage is about the same (93% US). The long tail of small companies in IBB could be under-performing (top 100 accounts for 53% only and 25% are rated as micro or small cap). FBT has about 18% in small and micro cap. Maybe one or two of the big companies are underperforming.
Some keen analysis here will identify the next winner but for me FBT looks a better way to go than IBB.
Sold
QBE Insurance Group Limited (QBE.AX): Australian/US Insurance. Closed out small position for 3.2% profit since January 2019. This holding arose after receiving a small parcel of shares in a dividend reinvestment plan after I had sold a holding. As the holding was too small to sell and cover trading costs I topped up. This trade made enough profit to cover all trading costs plus 3.2%. Why exit? Australia is facing a major claims cycle with bushfires in Tasmania and Victoria starting last week and massive flooding in Queensland too.
Income Trades
FireEye (FEYE): Cybersecurity. Price traded right down to $16 the day after earnings making my selling of 17 strike puts look premature (or even dumb).
Cryptocurency
Bitcoin (BTCUSD): Price range for the day was $33 (1% of the low). Price did nothing all day but it did hold away from the prior day low and from the last lower low (by $6). That gives more credence to the short term support level around $3322 (now a pink ray)
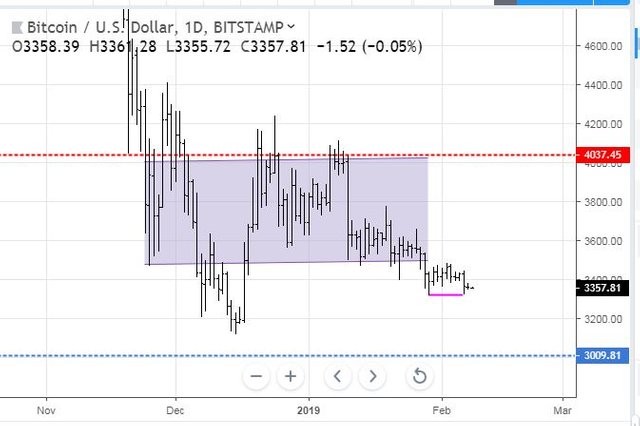
There is just nothing that looks like it will break the downtrend feel about the chart
Ethereum (ETHUSD): Price range for the day was $2 (2% of the low). This also did nothing all day. The short term support holds (pink ray)

CryptoBots
Profit Trailer Bot No closed trades
New Trading Bot Trading out using Crypto Prophecy. No closed trades
Currency Trades
Australian Dollar (AUDNZD): The Australian Dollar came under big pressure when the Reserve Bank of Australia (RBA) added a comment in its monthly statement that the next rate change in Australia could be a rate cut. That took the market by surprise as they were getting used to seeing a bid under the AUD on the back of weakening US Dollar. A lot of commentators are looking to a falling AUD as the global growth story unfolds. I went looking for options trades to place a 12 month out view.
- AUDUSD is the obvious choice but implied volatility was the highest
- EURAUD feels like a sideways market as the growth story bites into Europe
- GBPAUD feels too risky with Brexit stuff going on - even the AUD looks safe
- AUDJPY ruled out as I have enough long Yen exposure
- AUDNZD had the lowest implied volatility and I feel New Zealand economy is less tied to global trade. People will still need to buy New Zealand food.
I bought a 12 month to expiry 1.04 strike put option for $0.0261 premium. Let's look a chart which shows the bought put (1.04) as a red ray and breakeven as a blue ray with the expiry date the dotted green line on the right margin
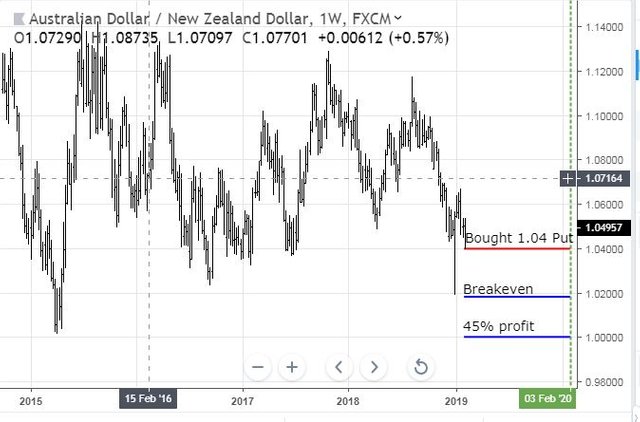
This looks like a dumb trade as price has to drop below the bottom of the range it has been in since since Q4 of 2017 and drop below 2015 lows get past 45% profit. One day after placing the trade this headline pops up and the New Zealand Dollar tanks 1%
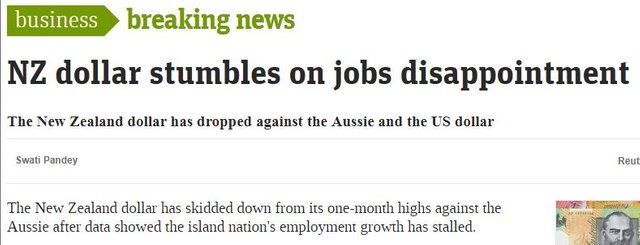
Now I have a trade management problem - dumb trade got dumber with the news flow.
- Ride it out. If my thesis is correct, the daily move on NZD will soon become a memory especially if the RBA does cut rates. 12 months is a long time.
- Scale in with another position. The good news is I only bought a half position - so I have dry powder.
- Make it a bear put spread to reduce the net premium.
Outsourced MAM account Actions to Wealth closed out 6 trades for 1.12% profits for the day. Of the 6 trades, ironically the 3 big winners were all buying NZD vs AUD - the day the NZD fell so hard. Profits on these trades make up for the dumb trade above.
Cautions: This is not financial advice. You need to consider your own financial position and take your own advice before you follow any of my ideas
Images: I own the rights to use and edit the Buy Sell image. News headlines come from Google Search and news.com.au. All other images are created using my various trading and charting platforms. They are all my own work
Tickers: I monitor my portfolios using Yahoo Finance. The ticker symbols used are Yahoo Finance tickers
Charts: http://mymark.mx/TradingView - this is a free charting package. I have a Pro subscription to get access to real time forex prices
February 7, 2019
Im curious about this thank you for posting
You are welcome. Plenty of posts to satisfy your curiosity - every time I make a trade and every trade. Just work backwards and follow the cross references to earlier posts.
Search works too - all my investing posts are tagged tib - just add that to your search expression - example tib insurance
Those EU/UK growth forecasts with the earlier indication from China’s own are pretty concerning for the long term sustainability of earnings growth given that most US companies have global business account for 45% of revenue. Important because earnings are the only real catalyst holding up the market and valuations.
Posted using Partiko iOS
Some of the talking heads are talking about zero earnings growth 2019. We are seeing sings of that in the forward guidance.
I just bought Hari Krishnan's book on Hedging - The Second leg Down. I will be reviewing hedging overall and adding in some of his thinking