TIB: Today I Bought (and Sold) - An Investors Journal #385 - US Semiconductors, TV Streaming, Network Equipment, Covered Calls, Altcoins (TRX, LTC)
Fed does nothing which is a move in its own right. Trade action is to jump onto trending stocks in semiconductors and TV streaming. A few more income trades in the bank.

Portfolio News
Market Rally
Federal Reserve holds rates and smacks the banks
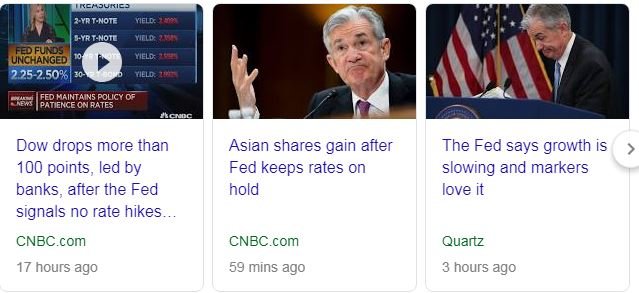
We learned what patience means to the Federal Reserve. Their view of the data is that there is no need for any more rate hikes in 2019. Markets take their cue and bid up technology stocks and knock financial stocks - banks cannot make money in a low interest rate environment
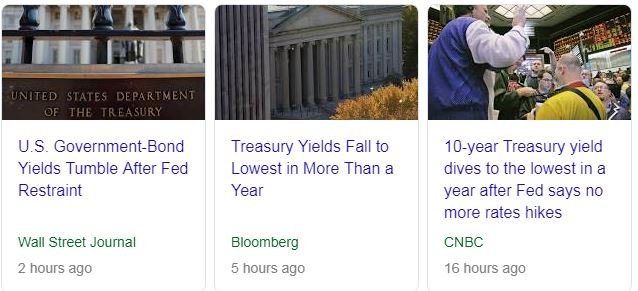
Treasury yields drop with 10 year dropping below 2.60% by 8 basis points.
US Dollar softens too
Brexit Bumbles
Theresa May sends in the request to Europe to delay the Brexit date to June 30.

This has become a massive standoff between the Prime Minister and the politicians on either side of the house in Parliament. Between them all, they have dithered around until the 11th hour and STILL nobody is putting their hand up to fix the problem. It seems they are all keen on a soft way out - so British. Where are Winston Churchill and Margaret Thatcher when we need them?
They want to commit to a close post-Brexit economic relationship with the bloc to ease disruption for businesses and citizens.
Cannabis Carnival
CVS Health group (CVS) joins the carnival by adding a range of CBD oil products to its product lines to be sold through 800 stores in 8 States
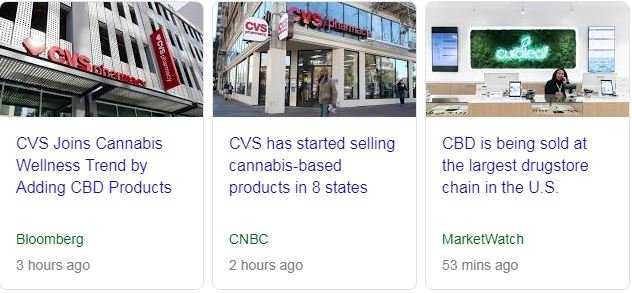
https://www.cnbc.com/2019/03/20/cvs-has-started-selling-cannabis-based-products-in-8-states.html
Bought
NVIDIA Corporation (NVDA): US Semiconductors. Jim Cramer initiated a new position on the back of AI and autonomous vehicle usage. The Nvidia investor day has highlighted their efforts in preparing for advanced cloud computing technologies as well. I went looking for options trades to see if I could find a low cost/no cost entry - call spread risk reversal time again. I bought a January 2021 175/225 bull call spread for net premium of $18.92 (offering profit potential on its own of 193%). I funded that premium by selling a January 2021 150 strike put for $19.67, bringing my net premium to a negative $0.75 - i.e., I get paid to make the trade. Risk in the trade lies in a strong correction in price or the markets that pushes price below $149.25. Against a closing price of $175.71, this would be price slippage of 18%.
How did I choose the levels? 175 was just in-the-money at trade time. 225 is about half way to the 2018 highs. The changes being made in the business should drive price ahead but it might take more than 22 months that expiry affords - I picked halfway. Finding the put was simply a process of walking through the options chains and finding a level that covered net premium and looked acceptable on a chart. The chart shows the calls as solid rays and the sold put as a dotted ray. There are two expiries on the chart as I do have a sold put expiring in April too.
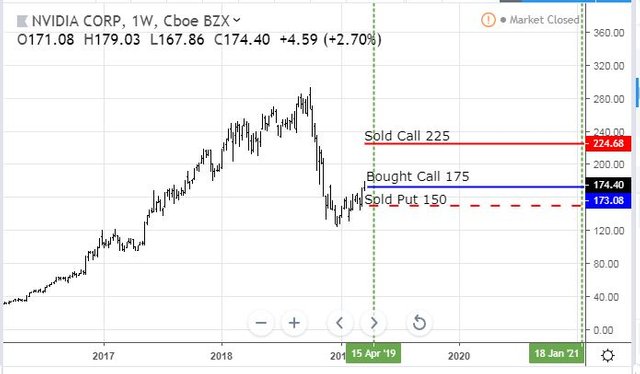
The positive trade outcomes are well within the previous trading ranges. The sold put level is a level I would be comfortable buying the stock for the long haul even though there is more downside below.
Roku, Inc (ROKU): TV Streaming. Roku has accelerated strongly after its earnings and then pulled back. I also went looking for options trades to see if I could find a low cost/no cost entry - call spread risk reversal time again. I bought a January 2021 65/80 bull call spread for net premium of $4.77 (offering profit potential on its own of 214%). I funded that premium by selling a November 2019 45 strike put for $4.57 bringing my net premium to a positive $0.20 - i.e., I paid. Risk in the trade lies in a strong correction in price or the markets that pushes price below $45.20. Against a closing price of $64.97, this would be price slippage of 44%.
How did I choose the levels? 65 was just out-the-money at trade time. 80 is just above the highs on the last run up. Finding the put was simply a process of walking through the options chains and finding a level that covered net premium and looked acceptable on a chart. I was quite keen to shorten the time exposure for this given how strong the price moves have been. I started from close in expiries and worked outwards - hence November 2019. Now it is possible to construct a January 2021 trade selling a put at a strike close to the bottom of the trading range - say 30 for $3.70 or 35 for $5.30. These are mouth watering premiums fr income trades.
The chart shows the calls as solid rays and the sold put as a dotted ray.
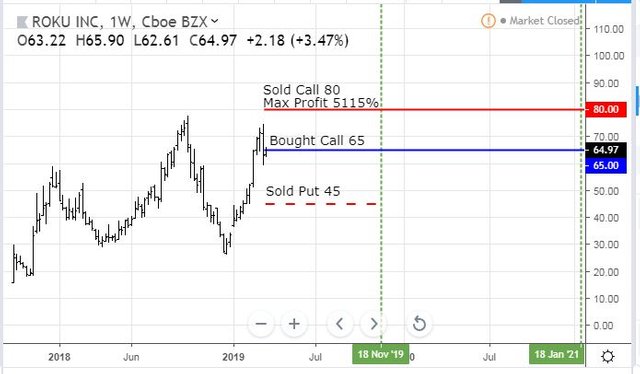
Target price is just above (4%) the top of the last range. Sold put is well below current price and about one third off the lows.
Income Trades
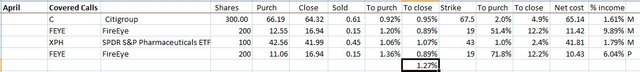
4 more covered calls written - all repeat trades from prior month. Average premium is now 1.27% (was 1.34%)
Cisco Systems, Inc (CSCO): US Network Equipment. Added one more naked put trade at 50 strike price vs closing price of $53.31 giving 6.6% leeway to strike.
Cryptocurency
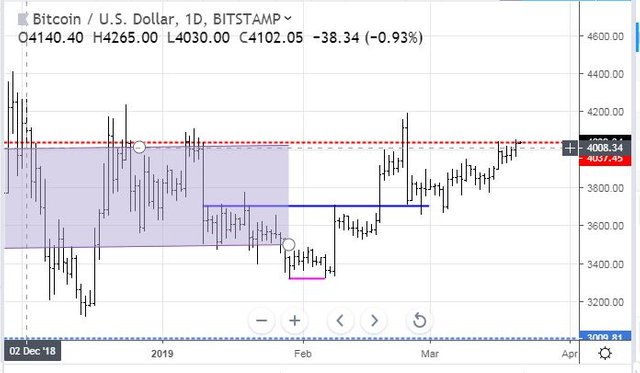
Bitcoin (BTCUSD): Price range for the day was $88 (2.2% of the low). Price did have a go at the resistance level at $4037 and pushed over for a bit and closing below. This is a higher high on this cycle
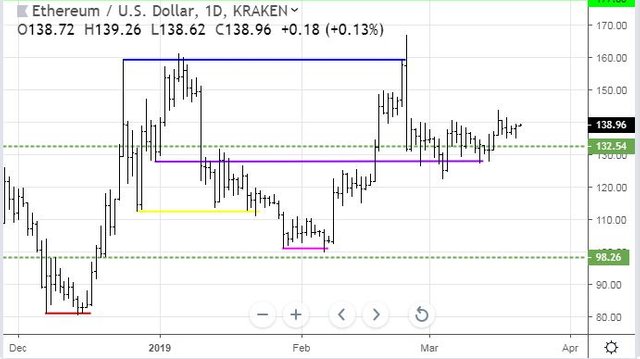
Ethereum (ETHUSD): Price range for the day was $4 (3% of the open). Price makes another engulfing type bar with open and close quite close together but not making a higher high. This feels less convincing than Bitcoin.
CryptoBots
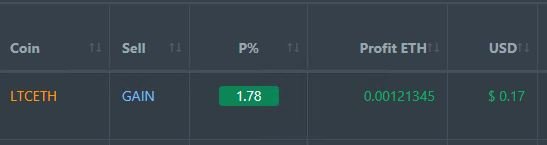
Profit Trailer Bot One closed trade (1.78% profit) bringing the position on the account to 6.94% profit (was 6.92%) (not accounting for open trades).
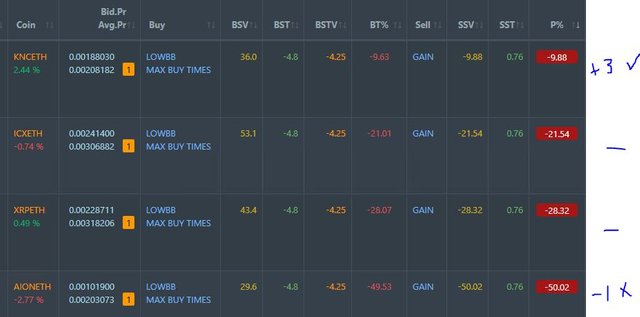
Dollar Cost Average (DCA) list remains at 4 coins with KNC doing its up and down thing
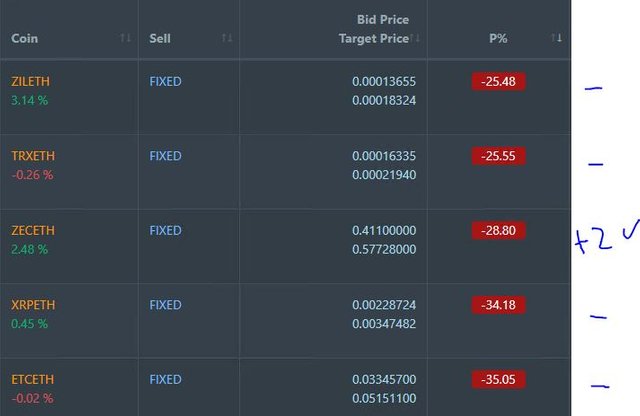
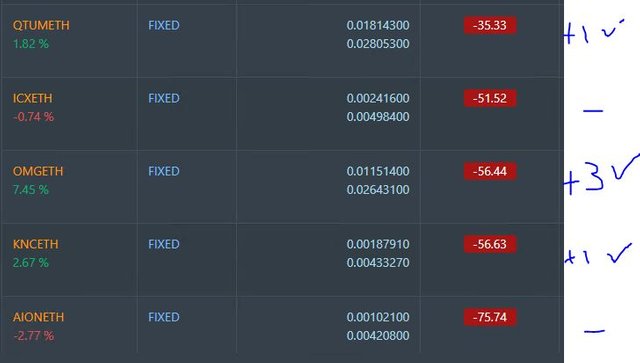
Pending list remains at 10 coins with 4 coins improving, 6 coins trading flat and zero worse.
PT Defender continues defending 10 coins. No change
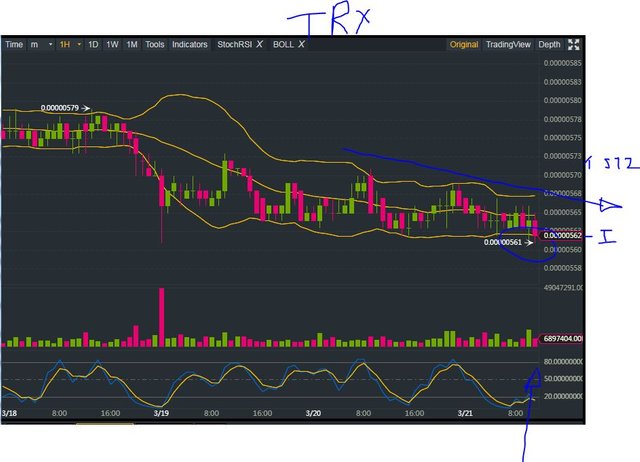
New Trading Bot Trading out using Crypto Prophecy. No closed trades. New trade on TRX - fits the rules though the chart does look like it is drifting lower with successive lower highs.
Currency Trades
Outsourced MAM account Actions to Wealth closed out 1 trade on AUDNZD for 0.2% profits for the day. Trades open short USDCHF are positive (0.68%). Not sure I would have made this trade with a Federal Reserve announcement due - they did and they are on the right side of it.
Cautions: This is not financial advice. You need to consider your own financial position and take your own advice before you follow any of my ideas
Images: I own the rights to use and edit the Buy Sell image. News headlines come from Google Search. All other images are created using my various trading and charting platforms. They are all my own work
Tickers: I monitor my portfolios using Yahoo Finance. The ticker symbols used are Yahoo Finance tickers
Charts: http://mymark.mx/TradingView - this is a free charting package. I have a Pro subscription to get access to real time forex prices
Crypto Prophecy provides a useful tool to identify oversold and overbought coins - https://mymark.mx/CryptoProphecy
March 20, 2019
Truly incredible to see the long end of the curve falling so much. I think they are overreacting but it can hurt financial sector as margins are compressed due to the curve. It seems like a self inflicting trend!
Posted using Partiko iOS
And worse again today. Back to the good old days of chasing yield.