TIB: Today I Bought (and Sold) - An Investors Journal #432 - Gold Mining, US Semiconductors, Gaming, Consumer Staples, Ripple, Corn
Mexico comes off the trade war list for now. Markets respond positively. Some profit taking, some shuffling of risky positions, some punts in frothy markets and time to add to hedging in gold.

Portfolio News
Market Rally
Markets rally with Mexico tariffs taken off the table (for now)
Mexico makes strides to bring forward things they were doing or had committed to doing and thereby avert tariffs being applied. The real problem is the genie is out the bottle. Donald Trump cannot be trusted to stand behind his negotiating teams before he reaches for the tariff blunderbuss. The scary part is he spends time over the weekend applauding the EU levying big fines on US technology companies. Is he beginning to think he could have another hammer to add to his toolbox - fines?. The markets sure hope not. It is nervous enough with DoJ and FTC actions last week.
Bond markets also show signs of relief giving back some of the drop in yields.
Markets can breathe until the next round of tweet warfare begins. Back to China is where the focus will go until the G20 meeting is my guess. It is only a guess.
Merger Activity
salesforce.com (CRM) announces acquisition of big data firm, Tableau Software Inc
saleforce.come share price drops 5% on dilution of shares from the stock for stock deal - Jim Cramer says to buy more at this level as he feels sure it will take a few weeks to recover BUT recover it will.
Cannabis Carnival
Tilray (TLRY) shares show signs of life after the big selloff has rumbled for weeks now.

The story behind the news is a little complicated but it highlights one of the challenges in the cannabis sector. The sector has done a lot of acquisitions for stock and/or raised capital from single sources each time putting stock into escrow for defined time periods. Share prices tend to fall over when the stock issued comes out of escrow. This price move was based on Tilray extending the escrow period for stock issued to Privateer (Tilray's largest shareholder). There is a kicker in the arrangement as Tilray will effectively take control of the Privateer Fund and there is a schedule by which shares will be trickled into the market to reduce the overhang. This effectively squeezed out most of the shorts. Good news in my portfolios which were somewhat under water.
Bought
VanEck Vectors Gold Miners ETF (GDX): Gold Mining. Watched CNBC Options Action idea on gold. Thesis is that gold has tested a level several times over the last 5 years accompanied by a series of higher lows. Price tipped past the previous high on Friday making that a higher high.
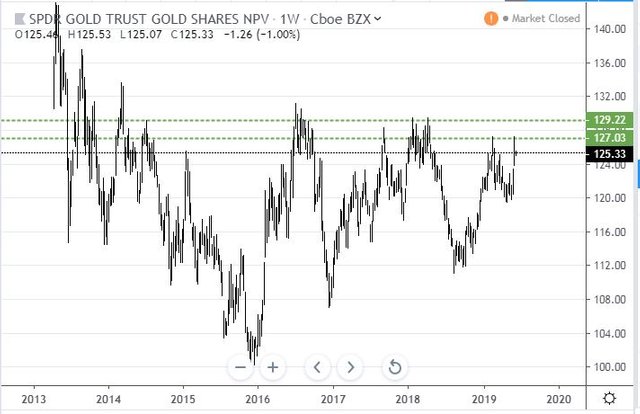
The trade idea was to buy an August bull call spread with net premium around $1.65. They did say there were a number of other ways to play this if one looked at gold miners. My idea was to buy a call only (i.e., not a spread) either on the Van Eck Gold Miners ETF (GDX) or the Junior Gold Miners ETF (GDXJ) for the same net premium so that I can retain the upside (and also buy it in portfolio that I cannot sell uncovered options). I also wanted to give myself a little more time to take in the September Federal Reserve meeting.
I bought one strike out-the-money September 2019 strike 22.50 call option for $1.46 (0.6% of strike) which was taken up at market open. I did note that price sagged after market open and in two portfolios I did average down by making another trade. Quick update of the charts which shows the new trades as pink rays with the expiry date the dotted pink line in the centre. 100% profit line is based on the high price and not the averaged down price - you can get a better profile trade.
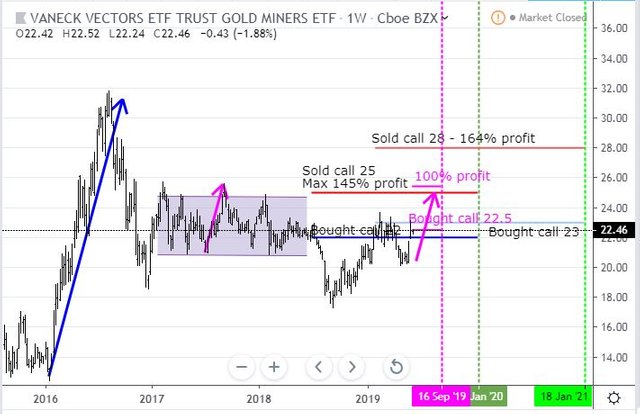
Excuse the crowding as the other trades I hold are also showing. The good news is price is back in the right zone to start showing positive momentum. I have modelled one of the up runs when price was consolidating (left hand pink arrow). A repeat of a move like that will take this new trade close to 100% profit and it will take the January 2020 22/25 bull calls spread to the maximum. The reason I wanted to be open ended is the blue arrow price scenario could play out in a short time frame like it did in 2016.
Yamana Gold Inc. (AUY): Gold Mining. Yamana has been one of my single mining company go-to investment arenas. They do operate several mines in Canada and Latin America. Bought a January 2021 2.5/4 bull call spread for $0.21 net premium (10.7% of closing price of $1.95). This offers 614% maximum profit but it is highly unlikely price will move 130% in 19 months. This is a spread I have been holding in one of my portfolios for some time. With price below $2, I really wanted to buy a spread closer to-the-money - brain fade stuck with the familiar.
I did add as an after thought a January 2021 2/3 bull call spread for a net premium of $0.25 offering maximum profit potential of 300% in one portfolio. Price does have to move (only) 53%.
Quick update on the chart shows the 2/3 bull call spread as pink rays and the new 2.5/4 bull call spread is called new, new trade.
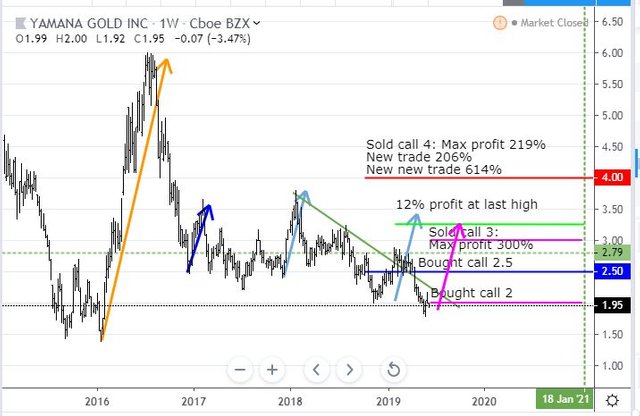
The chart looks a bit different to GDX with price not yet broken the last weekly downtrend (sloping green line) and just made a lower low in the last two weeks. This feels like a hit and hope trade. I have cloned the pale blue price scenario as a pink arrow. A repeat of that and the tighter spread trade will make the maximum but price will only reach the 2018 highs for 12% profit on the other trades.
This step back review tells me I made a mistake repeating the 2.5/4 bull call spread but my thinking was crystal clear on the 2/3 bull call spread. Brain saw one thing and fingers did another. Of course if price makes an ochre arrow price scenario I will look like a hero. Step back one more time and look at the GDX chart. There is no reason that Yamana cannot do the same as it has a portfolio of more than one mine - that was in the back of my mind as I did look at both charts at trade time.
What I like is each contract is less than the price of meal eaten out.
iShares MSCI Emerging Markets ETF (EEM): Emerging Markets Index. Talking heads have been talking about emerging markets as a growth based investing idea. I averaged down my entry price on a January 2020 strike 46 call option. With price closing at $41.61 this is well out-the-money. I was being lazy about finding a better strike further out in time. My guess is the China trade deal really has to be close to being done come January OR Trump will not get re-elected in 2020. If that happens this trade will be a big delta winner.
Corn Futures (CORN). Corn markets has been bouncing around in a range on 4 hour chart between $415 and $440 as the Mexico and China trade conversations ebb and flow. I added one new contract (right hand dot) on a reversal (on 1 hour chart) off the bottom of that range.
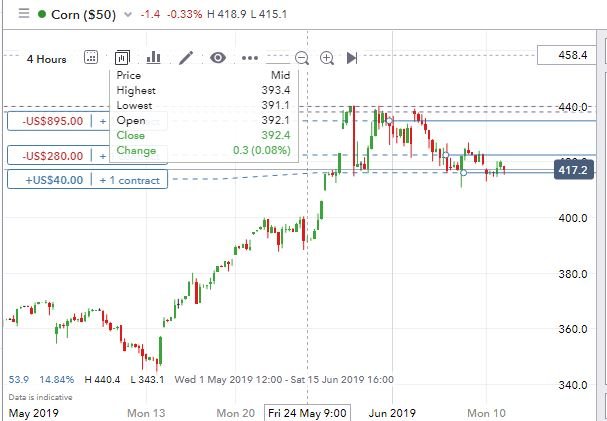
Profit targets are set on two contracts at the top of the range (top dotted red lines). This contract is a CFD contract on IG Markets which is not affected (directly) by futures rollovers. IG markets manages that mayhem continuously.
Sold
Advanced Micro Devices, Inc. (AMD): US Semiconductors. Closed January 2021 20/30 bull call spread with price holding steadily above $30 for a couple of days. 97% profit since November 2018. In this portfolio I am holding stock - I immediately sold the covered call below. The account is restricted from holding uncovered short positions. With the bull call spread closed I could write a covered call - the 3% premium was pretty enticing for 2 weeks of holding time. Quick update on the chart.
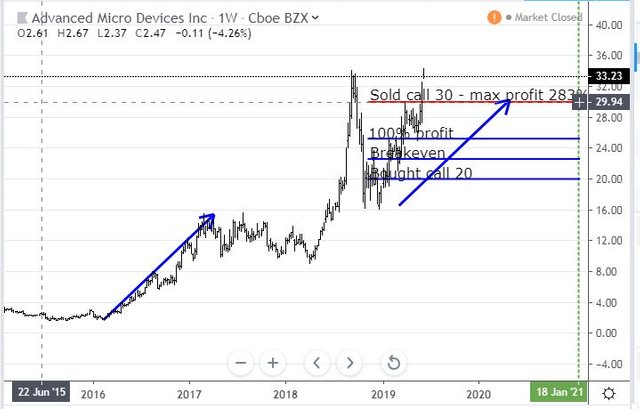
Price clearly went a lot steeper than the blue arrow price scenario. Monday price action also took price right past the covered call I just sold (at $32.50). There is a chance that it will fall back by next Friday - one tweet about China will do that. The trade set up was for a maximum profit of 283% and I got 97% = options still have time value and the decay on the sold call (30) is less than the decay on the bought call (20). I guess implied volatility has also fallen. Maybe the lesson is I could write contracts closer in in time - the slope of the blue arrow would suggest maybe a June 2020 would have worked BUT not January 2020.
Shorts
Consumer Staples Select Sector SPDR Fund (XLP): US Consumer Staples. Rolled out June 2019 strike 56 put options one month to July 2019 at same strike. Incurs 73% loss on closed trade. At the time I made the trade price was in the low 57's. I did look at rolling out to 57 strike but pricing was a little steep for me.
Las Vegas Sands Corp. (LVS): Casinos and Gaming. Following the review I did of uncovered puts last note (TIB431), I took action to reduce the risk of having to buy the stock at the 60 strike put level I had sold. I bought back the June 60 strike put option and rolled down to a 55 strike for July. This makes for a net 185% loss on this part of the trade if price stays above $55. I can mitigate this loss somewhat by selling a call to convert the open call I am holding in tandem to a bull call spread.
Starbucks Corporation (SBUX): Coffee. CNBC Options Action team reviewed Starbucks performance - feeling was price was a bit frothy especially with growing competition (especially in China). Trade idea was to buy August 2019 82.5/70 bear put spread. I followed the idea for a $2.80 net premium offering maximum profit potential of 346% if price drops 17.8% from Friday's close of $81.48. First day saw price drop below $82 to $81.93. Let's look at the chart which shows the bought put (82.5) and 100% profit as red rays and the sold put (70) as a blue ray with the expiry date the dotted green line on the right margin. Earnings dates are also shown as dotted red lines.
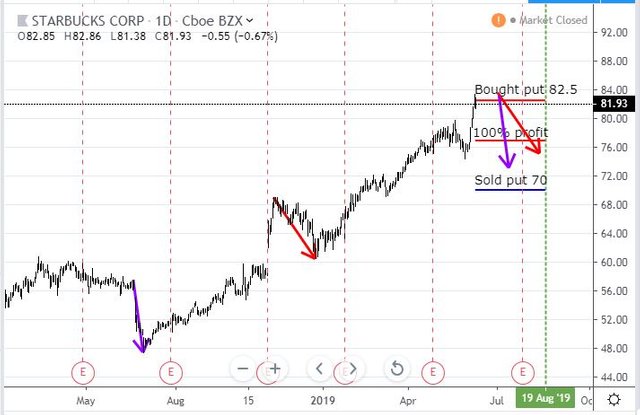
Price has almost doubled since July 2018 = frothy price earnings right there. The trade idea is that any earnings disappointment could pull price back in one of two price scenarios (red and purple arrows). Trade will need more than that size fall to make the maximum profit. Of note is those two drops were not triggered by earnings.
Income Trades
Advanced Micro Devices, Inc. (AMD): US Semiconductors. Sold June 2019 strike 32.5 calls for 2.17% premium (3.09% to purchase price). Closing price $31.82 (new trade). Price needs to move another 2.1% to reach the sold strike (new trade). Should price pass the sold strike I book a 45% capital gain.
Price passed that sold strike in Monday trade.
Cryptocurency
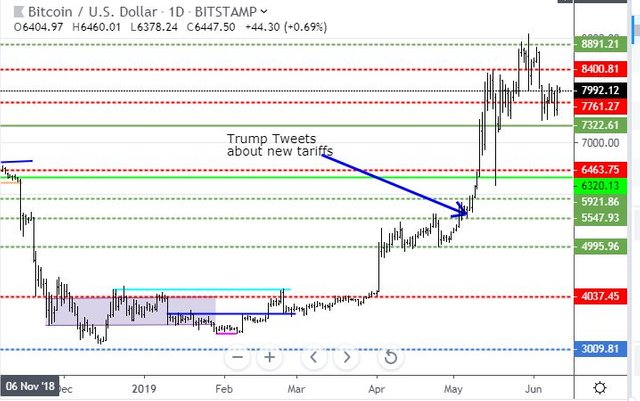
Bitcoin (BTCUSD): Price range for the long weekend was $685 (9% of the low). All the price action was in last two days of last week with price working its way around the $7761 support level. It looks like there are enough buyers lurking around that level (and a little lower). The sellers have set up camp around the $8000 level.
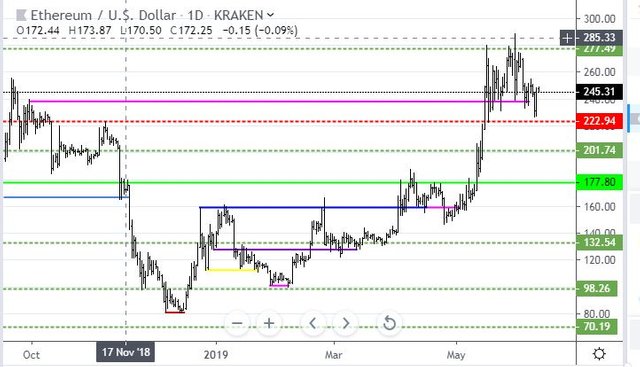
Ethereum (ETHUSD): Price range for the long weekend was $29 (11% of the open). Price tried to push away from the short term support level (the pink ray drawn in last week) and then had a go at testing down to the level below ($222). There are buyers there. We will see over the next few days if the buyers have been prepared to move up to the pink ray level ($238)
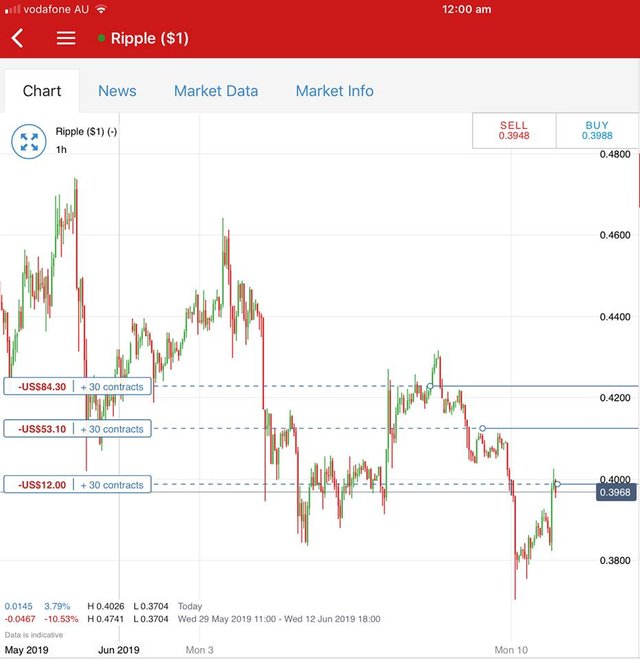
Ripple (XRPUSD): I got a message from a friend about a rumour that there was a consortium forming to dump Bitcoin via a Tether dump and potentially switch to Ripple. I try not to invest based on rumours (though I did hear this from two independent personal sources). I am exposed to Bitcoin and Ethereum through a number of CFD positions. I am less than keen to take losses on those for a defence move that may not actually be needed. Instead I went back to review IG Markets Ripple product offer. Remember I was concerned about the margin they required. Turns out I had misread the product specifications and margin is the same as Ethereum. I added 3 contracts at different times over the weekend as a hedging trade in the event the the story is correct and plays out. I am still exposed to Ethereum and Bitcoin but that is just fine for the long term. Chart shows 3 trade entry points (the blue dots)
CryptoBots
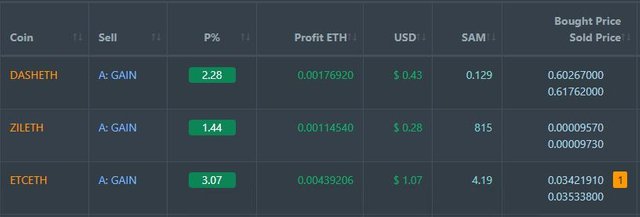
Profit Trailer Bot Three closed trades (2.26% profit) bringing the position on the account to 8.74% profit (was 8.61%) (not accounting for open trades). ETC trade after one level of DCA.
I have not yet corrected the cumulative profit numbers to account for PT Defender trades correctly.
PT Defender continues defending 11 coins.
New Trading Bot Trading out using Crypto Prophecy. No closed trades
Currency Trades
Outsourced MAM account Actions to Wealth closed out 5 trades on 3 days for 0.22% losses for the period. Biggest loser was short on XAUUSD just when I am starting to invest gold long. Trades open on AUDCAD, EURGBP, EURUSD, AUDUSD (just negative). Yet again trades open on either direction on one pair (EUR)
While I am critical of the outsource trader, they do better than I do on forex trading = just look at my tow trades last week = 100% loss record.
Cautions: This is not financial advice. You need to consider your own financial position and take your own advice before you follow any of my ideas
Images: I own the rights to use and edit the Buy Sell image. News headlines come from Google Search. All other images are created using my various trading and charting platforms. They are all my own work
Tickers: I monitor my portfolios using Yahoo Finance. The ticker symbols used are Yahoo Finance tickers
Charts: http://mymark.mx/TradingView - this is a free charting package. I have a Pro subscription to get access to real time forex and crypto prices
Bitcoin: Get started with mining Bitcoin for as little as $25 http://mymark.mx/Galaxy
Tracking: Keeping track of your crypto trades is a whole lot easier with CoinTracking.info. Get 10% off all your account upgrades https://mymark.mx/CoinTracking
June 6-10, 2019

I like the trade on GDX after the long term resistance line is broken...matches the Gold chart nicely.
Thanks. I must say I was not studying the break of resistance lines when I set up the trade. I saw the higher lows and the compression into the zone underneath the level. Add in a hedging mindset - trade on using options. A patient trade would be to wait for that level to be broken and retested.
Hi, @carrinm!
You just got a 0.41% upvote from SteemPlus!
To get higher upvotes, earn more SteemPlus Points (SPP). On your Steemit wallet, check your SPP balance and click on "How to earn SPP?" to find out all the ways to earn.
If you're not using SteemPlus yet, please check our last posts in here to see the many ways in which SteemPlus can improve your Steem experience on Steemit and Busy.