The stars look to be aligning for an equities melt up in the second half of 2019
This is a follow on from my previous post outlining the possibility of a fractal on the SP500 chart whereby the terminal phase of the uptrend that began with the bottom at 2347 at the end of last year is following the same pattern as the uptrend itself. Since then, we have seen a shallow correction back to the 200DMA, which marked the end of the first wave of the terminal phase. My current count now has us in wave one of three, as shown in Chart 1.
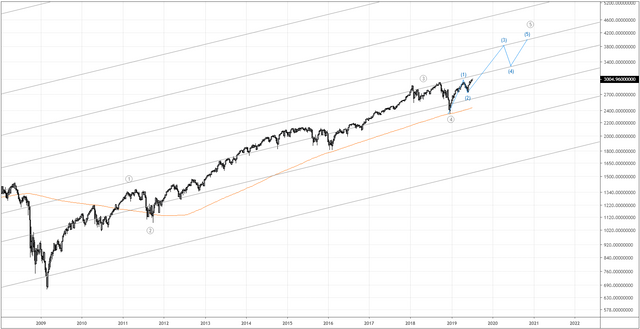
Chart 1. SPX weekly.
On a lower time frame (Chart 2 below), we can see what looks to be an ending diagonal completing wave one of three, which suggests a minor correction, perhaps down to the low 2900s and testing the 200MA on the H1 chart as dynamic resistance, before wave three of three begins.
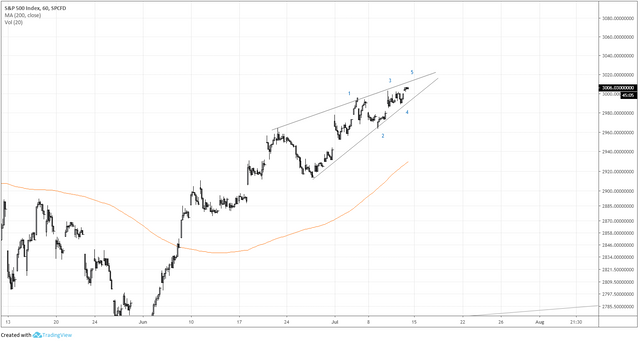
Chart 2. SPX H1.
All in all, the stars look to be aligning for an uptrend in equities that could run well into 2020 with the SP500 topping out around the 4000 mark. That would mark the end of the larger uptrend that began in 2009 and the beginning of a significant correction.