The crash of Cryptomarket [ ENG ] / Crollo del mercato delle cryptovalute [ ITA ]
Criptocurrency

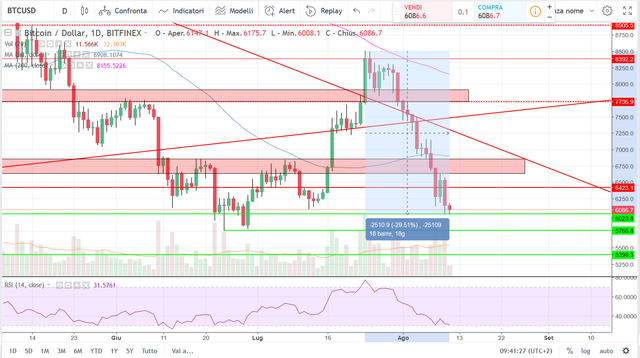
BITCOIN CHART 1D
| ITALIANO | ENGLISH |
|---|

In these days, several times a day I will publish articles about the different cryptocurrencies of the coinmarketcap.
This movement is not a simple correction but a real collapse. All supports with a strong push and the last levels that are $ 5,800 and $ 6,000 have been broken.
I highlighted the graph of the evaluation in 18 days and is 29.5%. It is a very high percentage if we consider that Bitcoin is one of the cryptocurrencies that has resisted the most.
We had identified an area around $ 6,800 on which there was a 50-period moving average and support support; this level is a success of $ 6,000.
At other times I said that the price can go down also due to an absence of buyers, but this is not the case,
One last level that could be exceeded that of $ 5.780 on which there is a minimum formatted more than a month ago.
For now we can only wait for the situation to calm down without going out and entering the market. I am waiting for new bullish signals and I will keep you updated in the next articles.
It is not possible to base operations on news regarding collaborations or technology. Many believe that this collapse was caused by the failure to approve ETF. I don't support this idea because it is now several months that the market is being manipulated and doesn' t follow any technical or fundamental analysis rule.

In questi giorni, più volte al giorno pubblicherò degli articoli riguardanti le diverse cryptovalute del coinmarketcap.
Questo movimento non è una semplice correzione ma un vero e proprio crollo. Sono stati rotti tutti i supporto importanti con una forte spinta e gli ultimi livelli che restano sono a 5.800 $ e 6.000 $ .
Ho evidenziato sul grafico la percentuale persa in questi 18 giorni ed è del 29,5% . E' una percentuale molto alta se consideriamo che il Bitcoin è una delle cryptovalute che ha resistito di più alla caduta.
Avevamo individuato un'area intorno ai 6.800$ su cui c'era la media mobile a 50 periodi e un'area di supporto; questo livello dopo un paio di giorni di indecisione è stato rotto con forza e il prezzo si è portato sulla soglia dei 6.000 $ .
Altre volte ho detto che il prezzo può scendere anche a causa di un'assenza di compratori, ma non è questo il caso, se si notano i volumi si vede come la spinta ribassista ha superato di molto la media dei volumi giornalieri.
Un ultimo livello che potrebbe raggiungere è ormai quello dei 5.780$ su cui è presente un minimo formatosi più di un mese fa.
Per ora possiamo solo aspettare che la situazione si tranquillizzi senza uscire ed entrare nel mercato. Resto in attesa di nuovi segnali rialzisti e vi terrò aggiornati nei prossimi articoli.
Non si può basare l'operatività sulle notizie riguardanti le collaborazioni o la tecnologia. Molti credono che questo crollo sia stato causato dalla mancata approvazione del ETF . Io non appoggio l'idea perchè ormai sono diversi mesi che il mercato viene manipolato e non segue alcuna regola di analisi tecnica o fondamentale.


Grazie per l'analisi. Vedremo come andrà a finire sta cosa.
Per fortuna ho iniziato a comprare qlcsa a marzo 2017, dove tutto era relativamente basso.
Salutoni
Hai comprato abbastanza presto da poter permetterti di non uscire dal mercato, cosa che non tutti possono fare.
Tutta manipolazione pre ETF, personalmente mi sono concentrato su btc, investire in altcoin al momento è troppo rischioso. Usate tensorchart, strumento molto utile che ho sfruttato per rientrare su btc ai minimi di queste ore
Anch'io uso Tensor Chart credo sia un ottimo strumento per vedere i volumi, comunque è stata un' ottima operazione se eri già uscito dal mercato.
molto utile perchè grafica tutto l'order book e filtrando gli ordini grossi ci si muove più agevolmente. Si ero tornato in tether dopo la crescita delle ultime settimane, diciamo che ho sfruttato il tutto accodandomi alle balene
Se si riesce a seguire gli order book e le balene si ha un vantaggio su tutti gli altri trader e soprattutto un vantaggio statico sul guadagno
You got a 8.57% upvote from @postpromoter courtesy of @giu-marcantuono!
Want to promote your posts too? Check out the Steem Bot Tracker website for more info. If you would like to support the development of @postpromoter and the bot tracker please vote for @yabapmatt for witness!