Interbank Rates and what we can learn from them
Interbank overnight rates such as LIBOR determine the interest rate which big city banks charge each other for borrowing money.
This is significant because we can see interbank lending rates as a means of determining how risky the banks consider it is to lend other banks money.
So thus a rate which attempts to price possible systemic risk in the economic environment.
The most common interbank overnight rate is LIBOR and is focused around banks based in London (hence stands for London Inter Bank Overnight Rate)
Here is a chart for it.
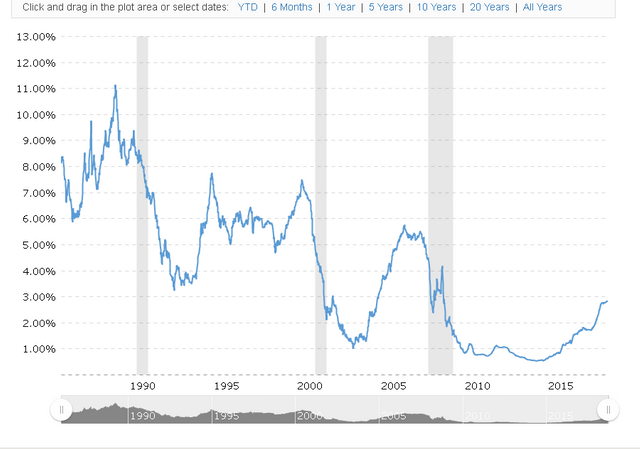
We can take a lot of useful info away from the LIBOR chart by applying technical analysis to it.
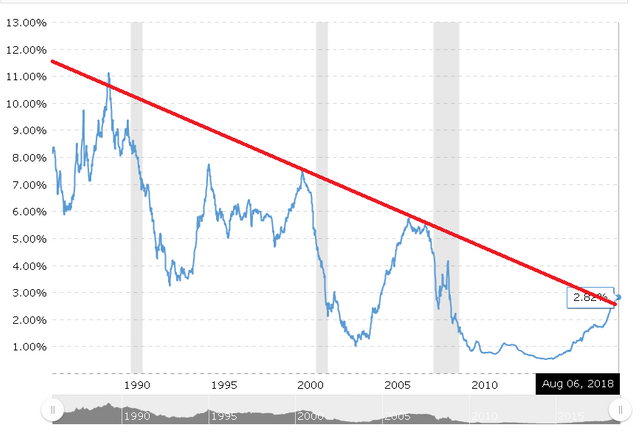
The most obvious thing which everyone should notice is the clear downward channel which we can represent by using a pair of parallel lines.
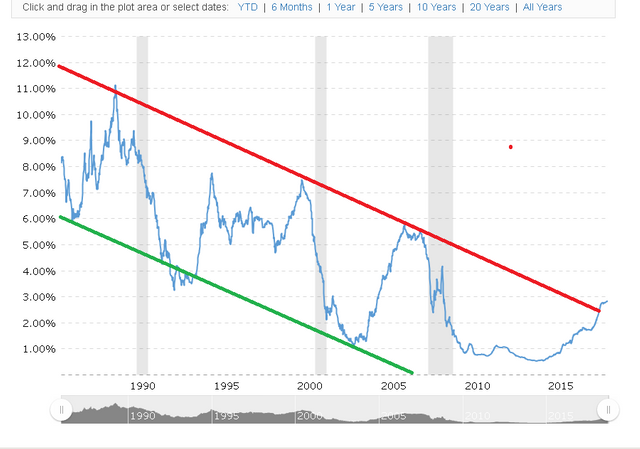
This shows that LIBOR has been on a clear downward trend since probably the 70’s if not before.
We can also deduce the following:
Libor clearly tracks economic risk and spikes precede recessions.
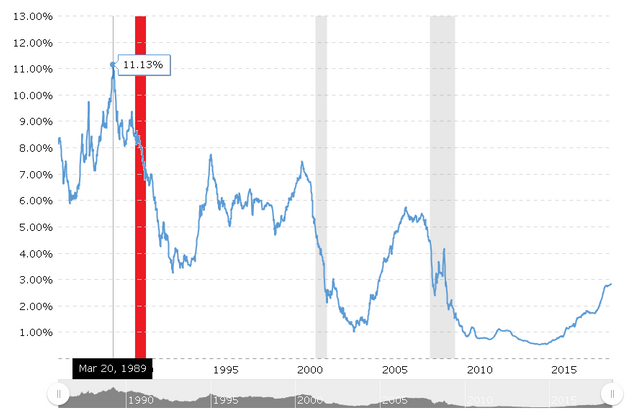
If we look at the last big recession which kicked off at the end of Q4 2007 (highlighted in red in the chart below) then the maximum of LIBOR for this period occured in June 2006 a full year-and-a-half earlier.
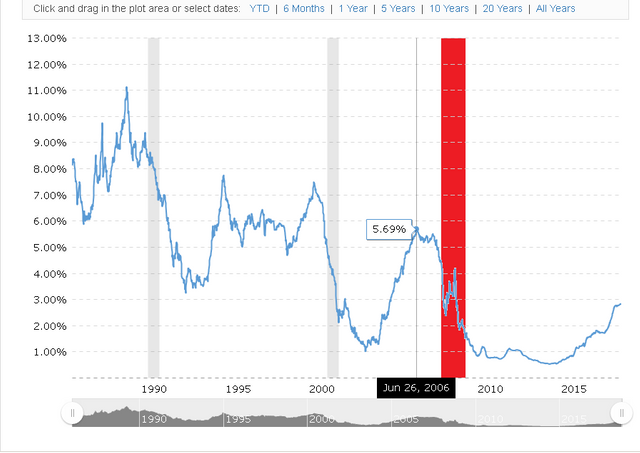
We see the same thing happening in the early 2000 recession with the LIBOR maximum for this period occuring in May 2000 and the Dotcom bust recession following about 9 months later.
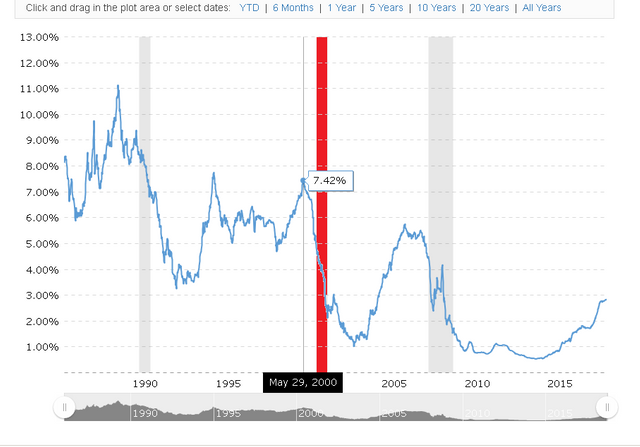
Finally we see that the Maximum for the early 90s/late 80’s period occurred in March 1989 and then we experienced the early 90’s recession around a year later.
The pattern here is clear.
LIBOR maximums are warning signs for recessions.
Don’t forget, that LIBOR is generated not by journalists or industry votes or anything, but by the activities of banks who are well aware of the risks present in the financial system (even if they do choose to ignore them at face-value).
So let us think, we are at the current maximum for the 2010 era period and very clearly pressed up against the roof of the downward channel.
The implications here are vast and as such are as follows:
- If history repeats itself, then we can expect a serious international recession before 2020.
Every maximum has preceded a recession by around 1-2 years. We’re at the maximum for our current cycle right now. So logically, if history repeats itself then a recession is already in the making.
- LIBOR usually collapses before a recession actually begins.
LIBOR usually collapses before a recession actually takes hold. We can see this by looking at the charts above. The maximum always capitulates and collapses with the recession following shortly afterwards
- If LIBOR defies this trend and continues to rise then it will breach a downtrend that is well over 30-40 years old.
The implications for this are vast and ultimately, would be a game changer. This has never happened before however, we must also ask what the alternative is.
- If LIBOR DOES NOT breach the channel and violate the trend then within 10 years we will see a sub-zero LIBOR rate.
The implications for this are again, staggering as there has never to my knowledge been a sub-zero LIBOR rate (meaning the banks would effectively pay each other to take money out – a bizarre situation which I cannot see occurring). I consider this effectively impossible.
So make no mistake, big games are afoot here. There is no way in which I can see sub-zero LIBOR rates occurring, so I consider the most likely situation to be that the channel eventually breaches and we begin to see higher overall interest rates over the next decade. This fits with the general agenda of central banks worldwide who are seeking to “normalise” interest rates and escape from the artificial low interest rate environment which the 2008 crisis threw the world into.
How To Use This Information
To summarise, LIBOR can be used as a recession detector. However, we must bear in mind that conditions dictate that there is very little room for LIBOR to move substantially in one direction or another without either breaching the trend or violating the 0% barrier.
This means the following:
- A breach of the channel signifies fear is rising substantially.
This would be the first unknown-unknown. However, my projection would be that LIBOR rises to around 4-5% if the channel is breached before a maximum is reached. This fits with what happened with the 2008 recession.
- A maximum is usually following by a plateau before collapse occurs
If we look at the 3 maximums on our charts, we can see that Libor in both the early 90’s example and the 2008 example experience a plateau before they collapse.
- A collapse means a recession is imminent
Historically, whenever LIBOR capitulates a recession occurs mid-way through the capitulation. The chart shows that a substantial move of more than a single percentage point to the negative indicates collapse is underway.
Assuming history repeats itself then I consider these rules a good way to use LIBOR as a recession canary. This is especially important because if the trend repeats then we’re already most of the way there and this warrants close attention.
@intellivestor, I gave you a vote!
If you follow me, I will also follow you in return!