ZenCash ZEN get your oscilloscopes ready, "it's about to go down!" [Technical Analysis Indicators Tutorial]
haha that's a figure of speech^^
for information about what ZenCash is, see our post:
https://steemit.com/zencash/@cloudconnect/volatile-zen-be-one-with-zen-oscillate-with-zen
Here is ~6 month view of ZenCash:
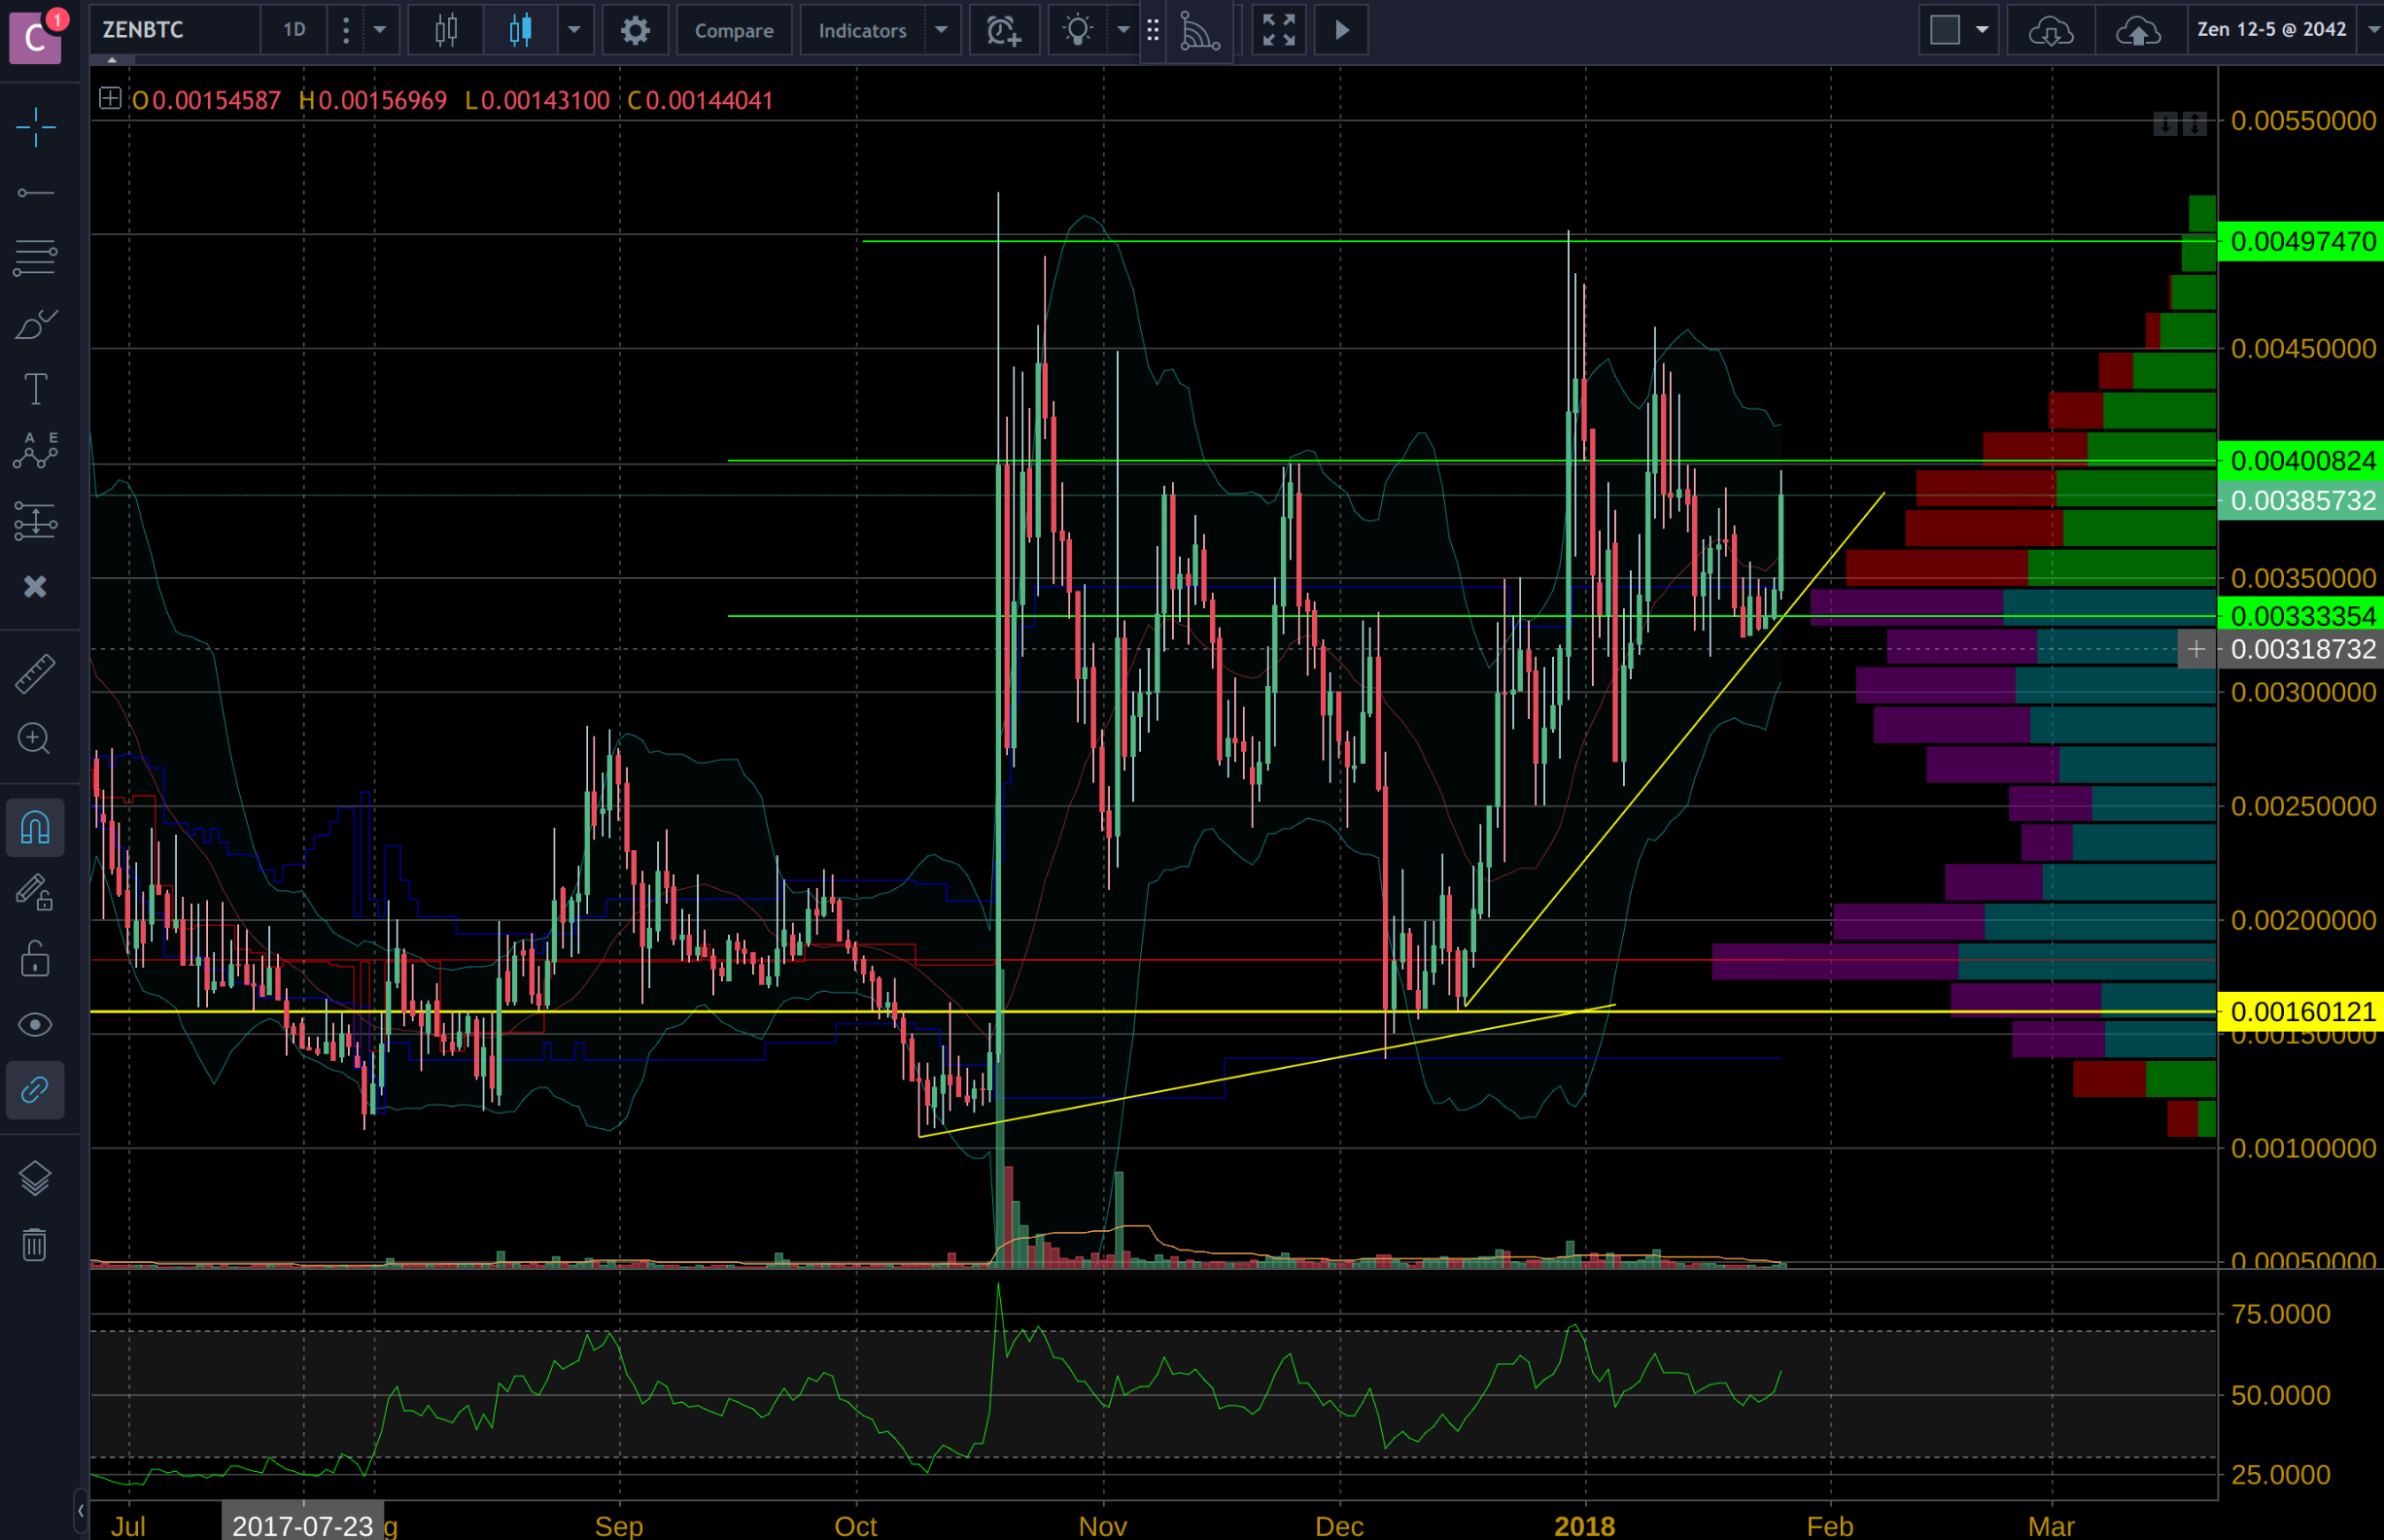
What I marked were some major support lines and bottom price trends. These help me think about where things are going and where they have to go first to get there. This so-called "lay of the land" can help us think about the "bus stops" if the price action is a bus lol.
The visible range shows you the volume traded within the window frame. The teal and purple bars of the histogram are where 70% of the volume was traded, and the horizontal red line is the Point of Control (POC), look it up.
6-month view shows the POC is pretty low because that includes all the activity before that local ATH. This tells us that trading was active before the event. If sentiment changed irrevocably after the event, we may not be able to rely on that point, however, ZEN is known to have a lot of volatility, so if the price drops low, buy, instead of fear selling. One strategy is to play both sides!
A 3-month view is shown below:
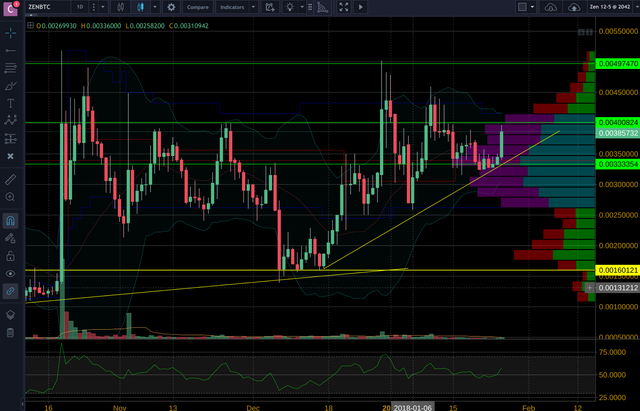
This is after that big price jump. We can see that a new POC developed basically in the middle of that fatty oscillation. To a day trader that is gold cream! Also, see the support base at 0.0033354: I'm grateful that I placed that before I zoomed in, which confirms that it is a good placement. As you can see the POC is in agreement.
I zoomed in to a 1-month view (~Dec 25-Jan 26), used higher resolution, and a Fib retracement to see if ZEN agrees with the natural emergence of numbers ;P
See for yourself:
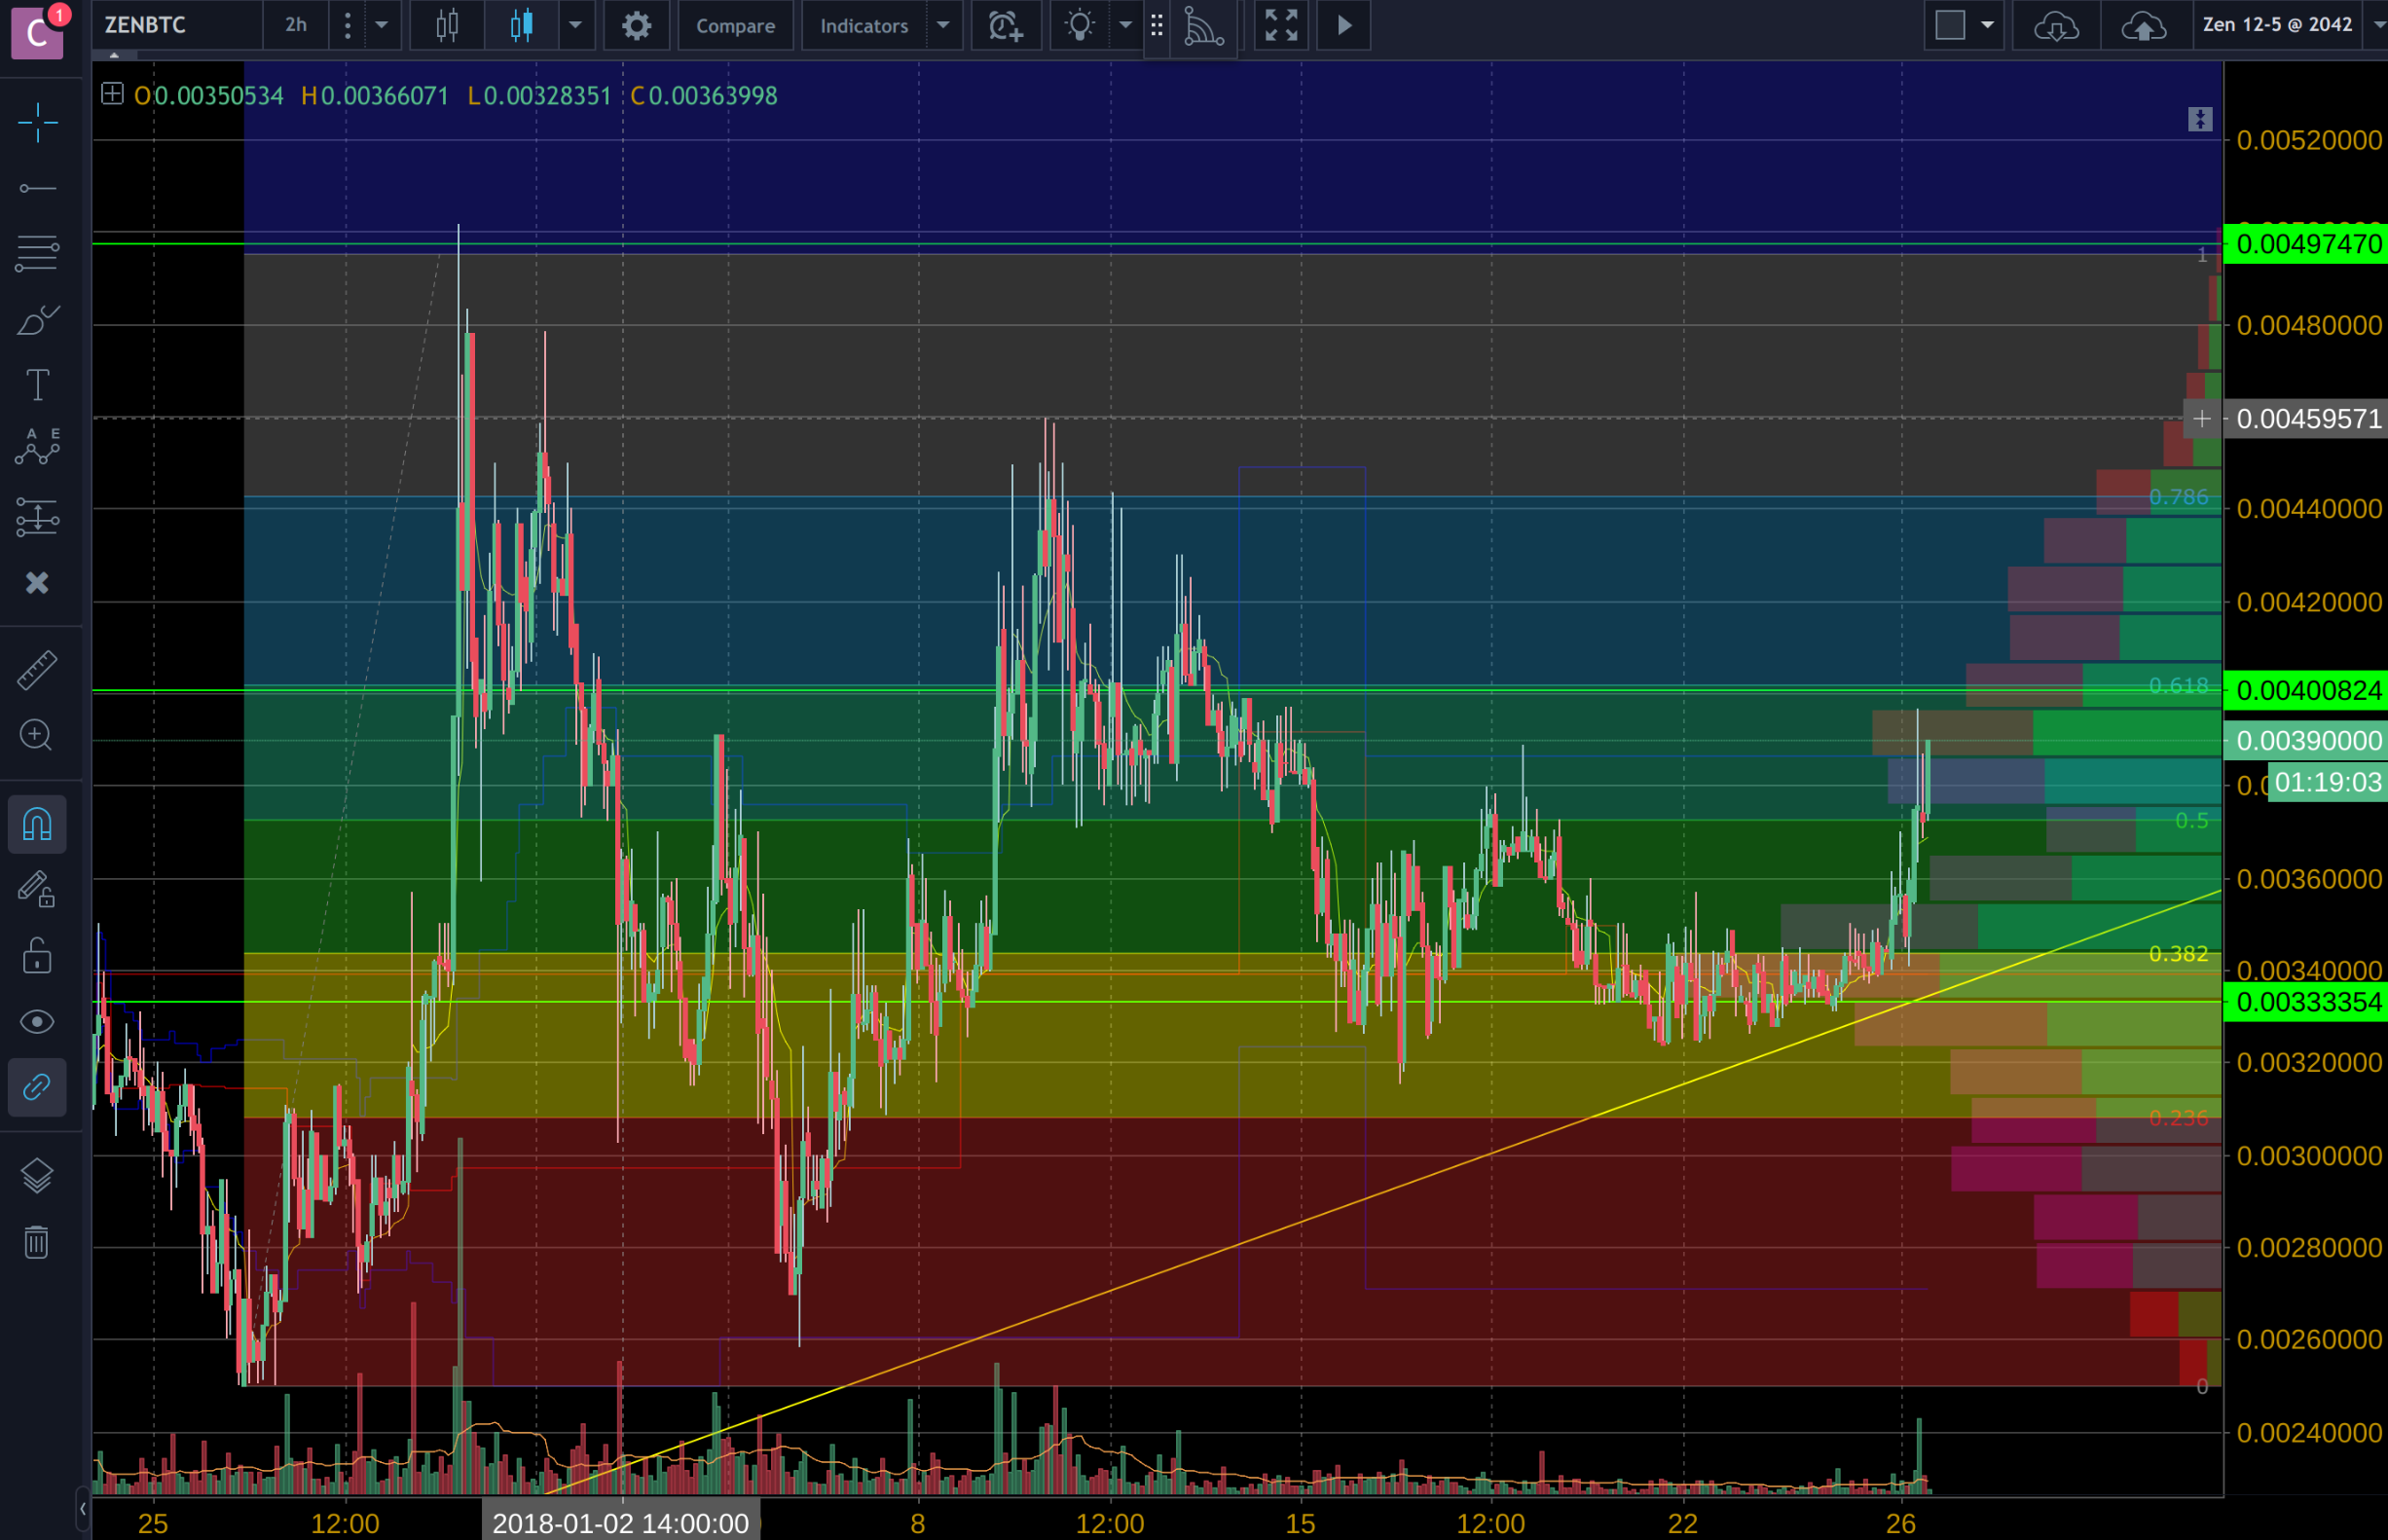
The POC, my support base placement, and 0.382 Fib ratio line are all around 0.33% of each other. I would call those the effectively the same. I eyeballed that, but if I ran the numbers, I would expect it to not be statistically significant.
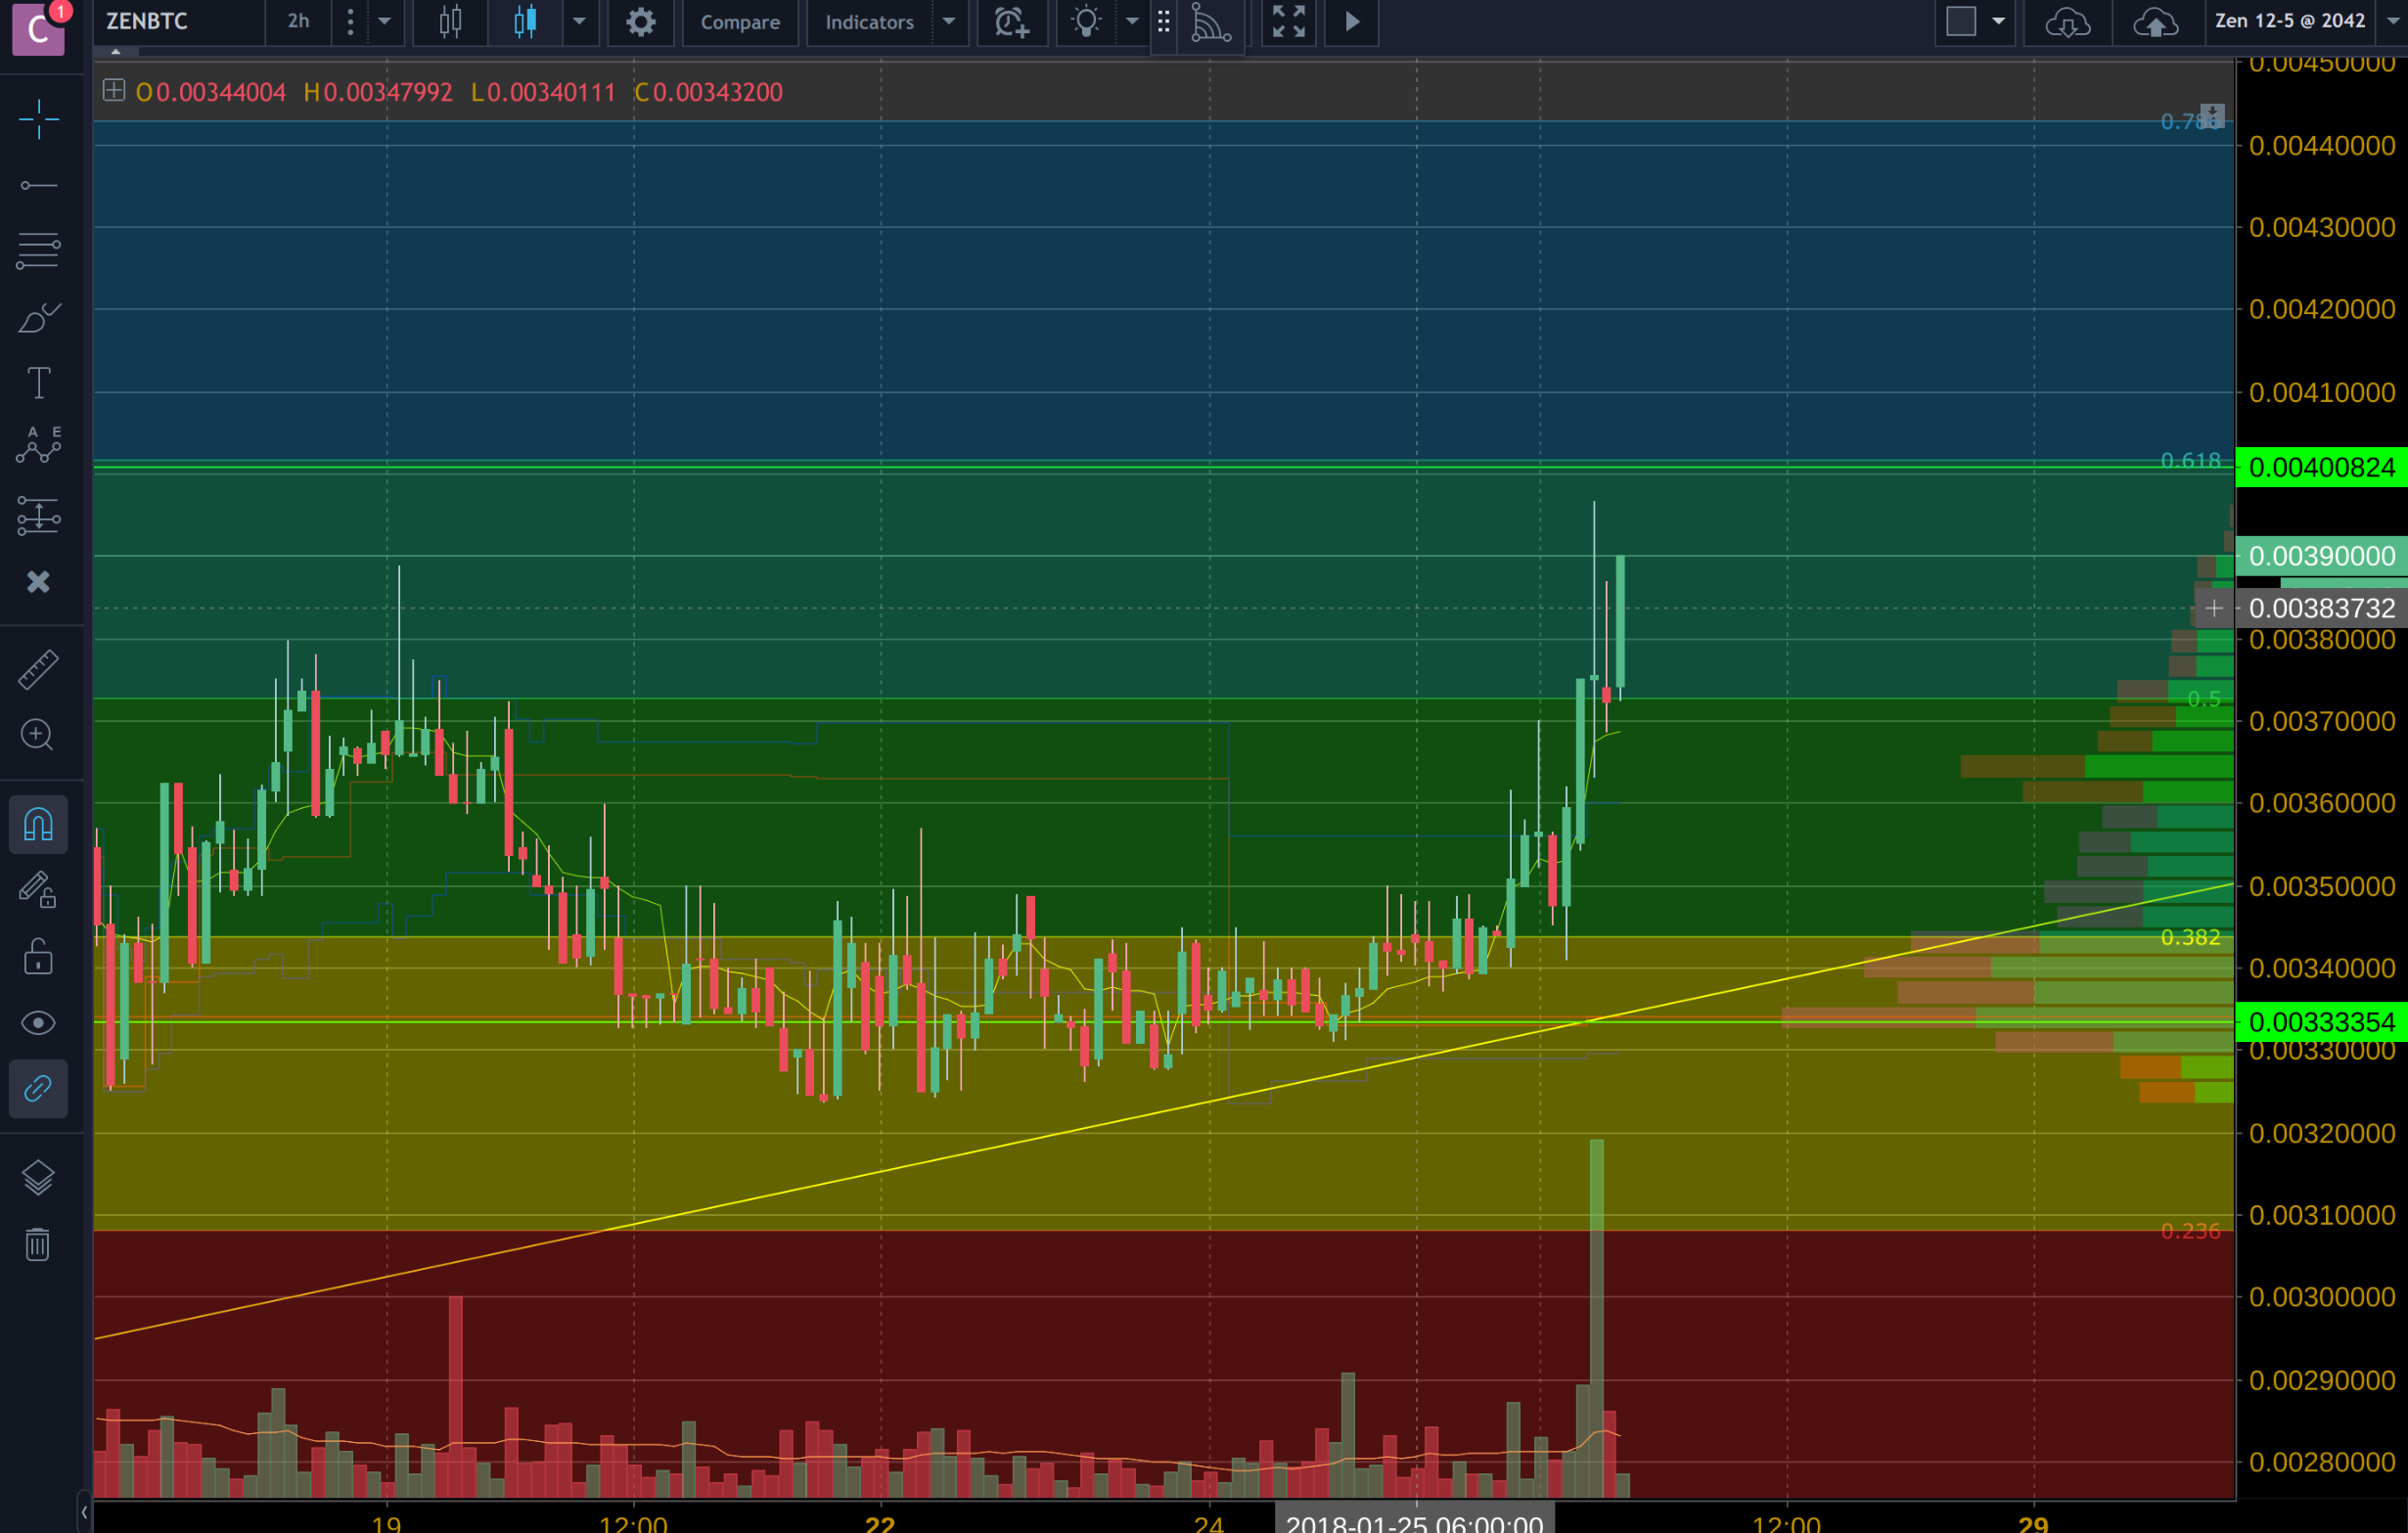
Zooming to bring the latter 3 weeks of January into the frame:
We can see ZEN tested the 0.618 line and may be settling at the 0.5. Keep the 0.382 in mind, however, ZEN can be volatile. With the Visible Range you can see two major support areas.
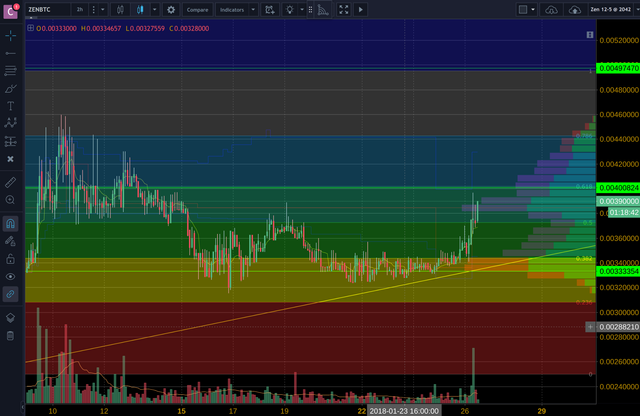
Zooming into the 7-10 day view, the support bases are serving as oscillatory boundaries.
I removed the Fib for visibility and adding TTM Squeeze and Bollinger Bands to help us think about volatility.
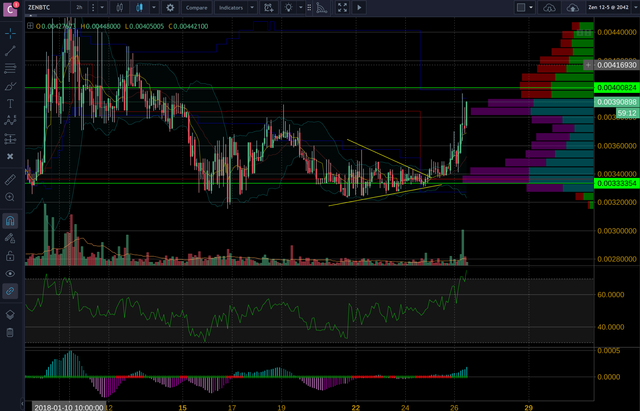
I drew the yellow triangles to help you see that "consolidation" before the beautiful spike.
Below I wanted also to point out were the VWAP is.
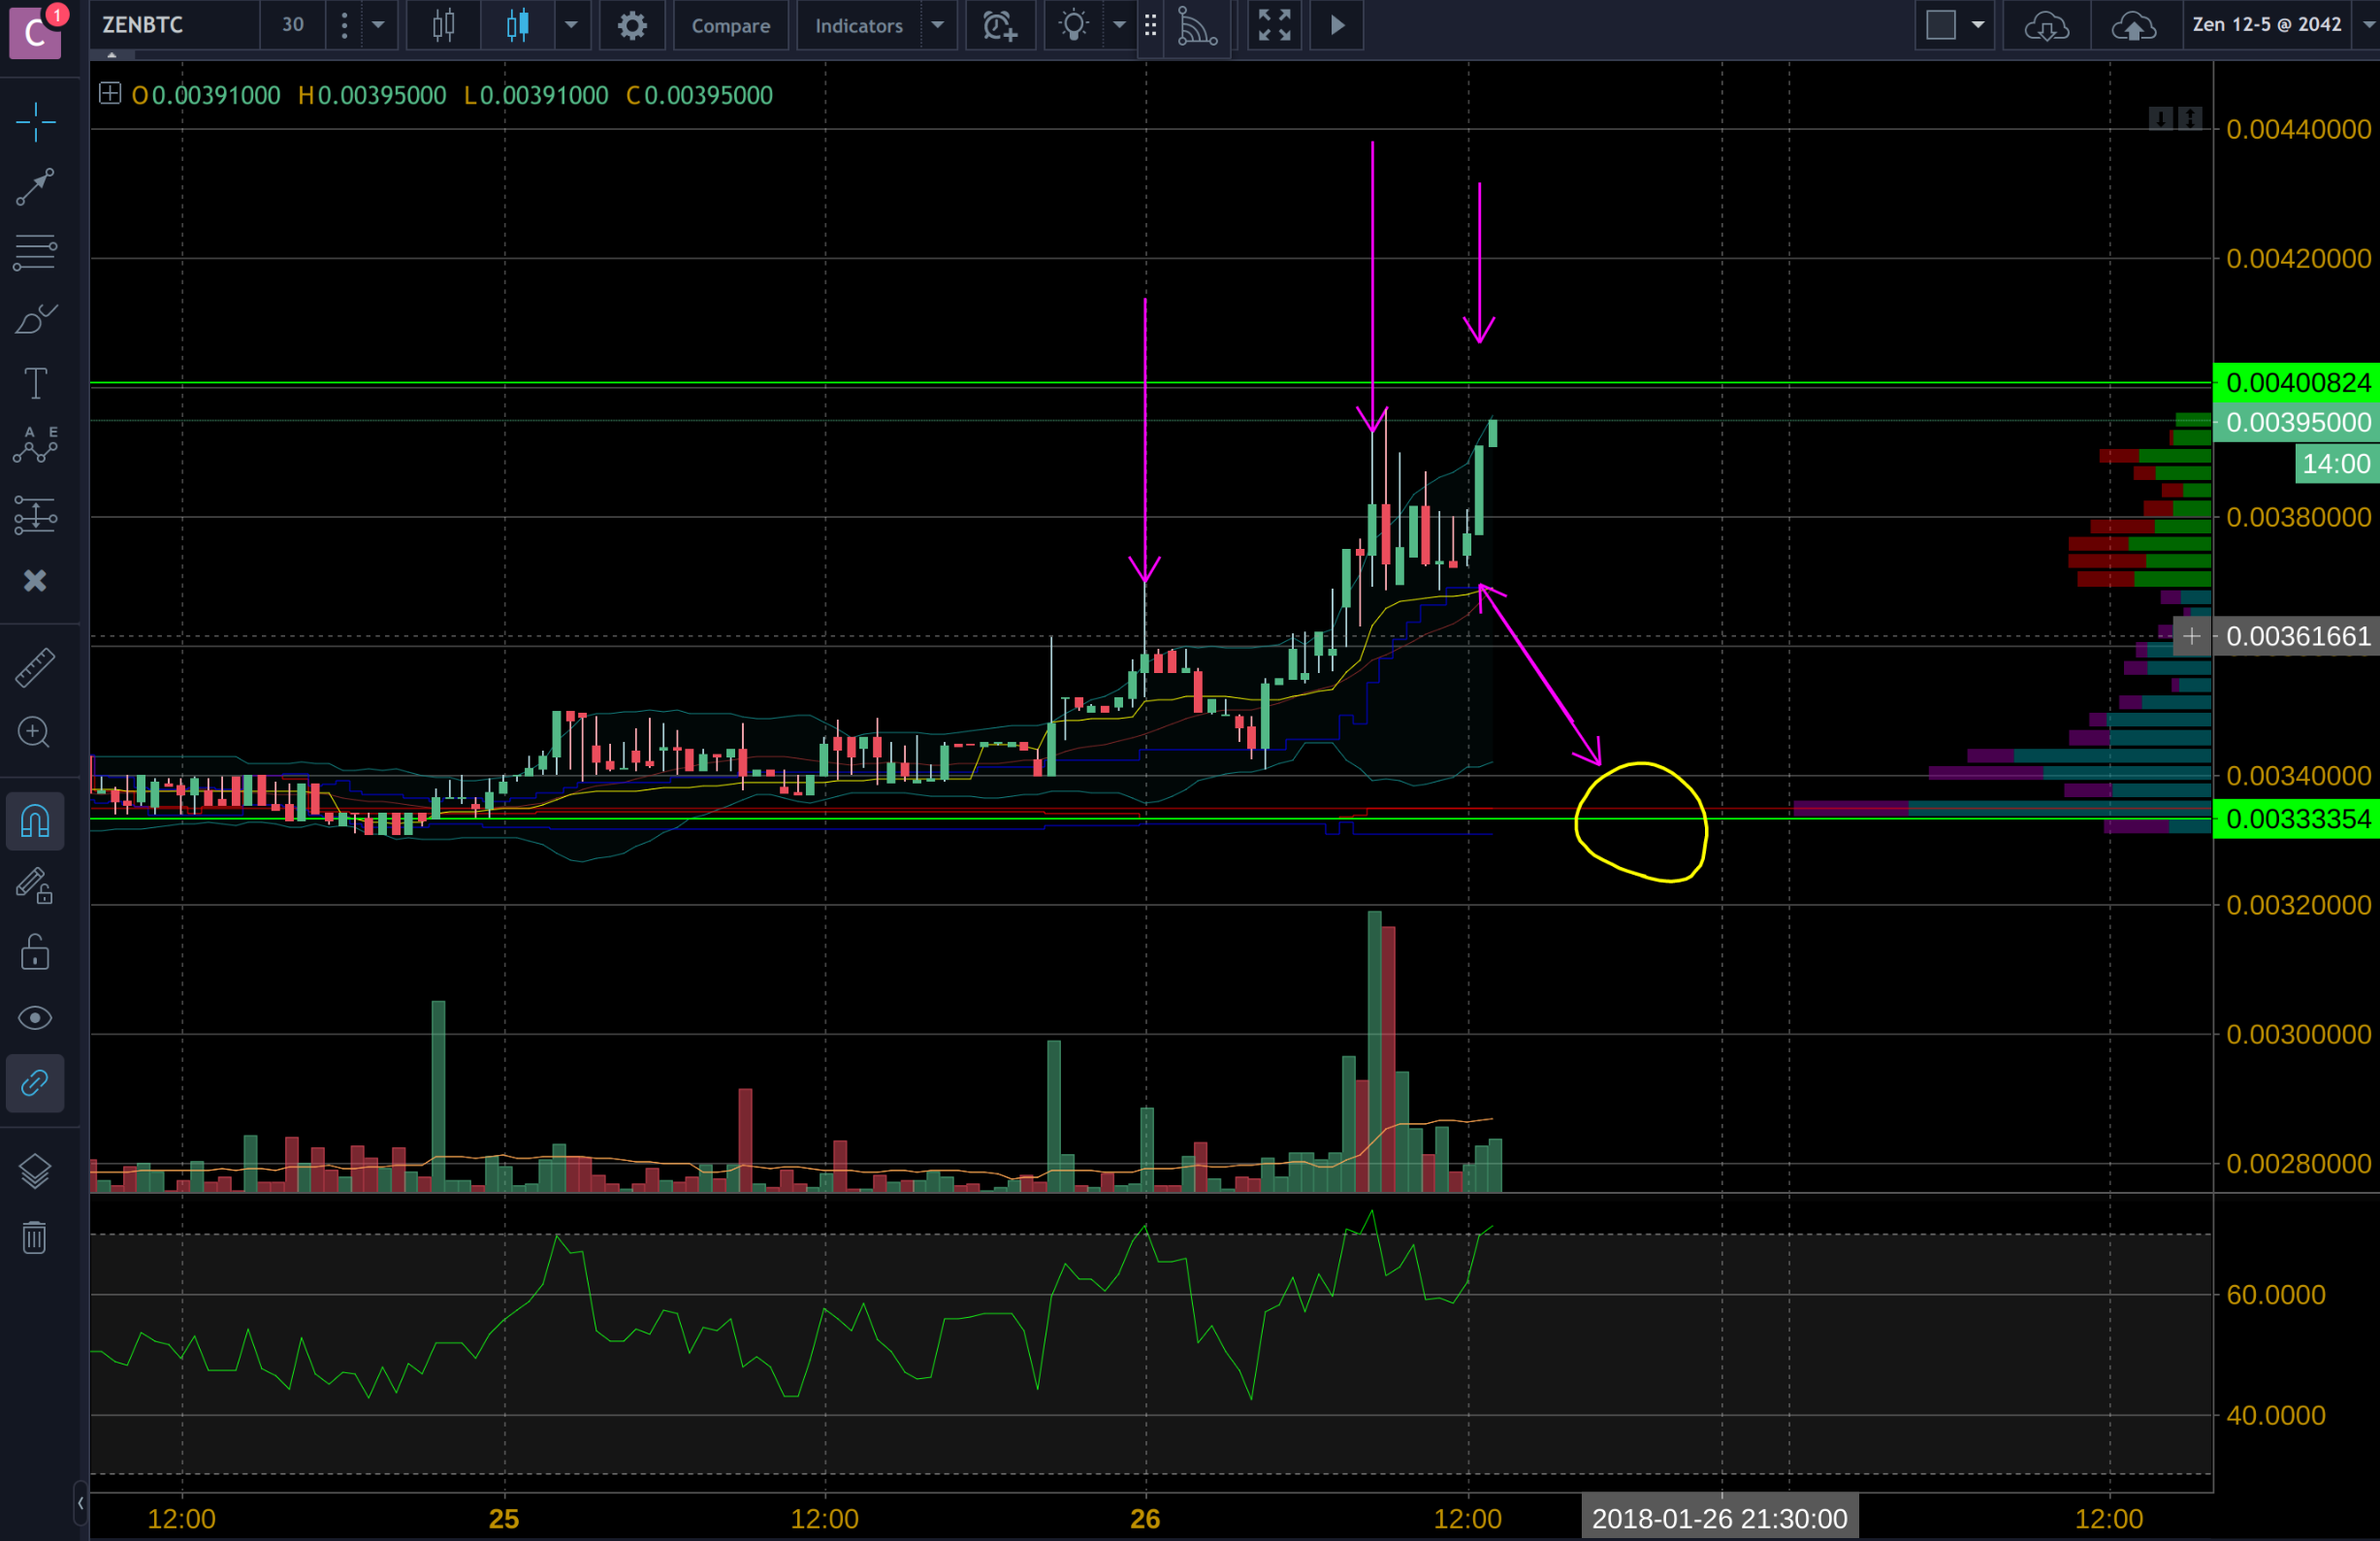
It's the yellow line that is slightly below the latest candle. At this resolution of 30mins and zoomed in, we can see that it may be possible to see some price action downwards to correct the latest price spike.
Purple arrows are there to show you the relationship between the Bollinger Bands and the RSI. These can be used to help us discover price reversals. It is shown here to be testing the upper price capabilities. It seems to me that there is a lot of momentum to be testing it so, however, it may be slowing down.
I hope this tutorial with ZEN has helped you to better understand some indicators. It has helped me, too, to explain it!
This was for entertainment purposes, so don't take this for financial advice!
If you enjoyed this post, please, RESTEEM, UPVOTE, COMMENT!!
Suggestions, corrections, and thanks are welcome.
PEACE + ZEN
Thank you for taking the time to do a technical analysis of ZenCash. It's great that you bring visibility to the project!
You're welcome. It was a joy to write, and thank you for noticing! It is an honor to be graced by a ZenCash Vet!