Zane's Crypto Recap: Litecoin (LTC) 17 June 2017
Zane’s Crypto Chart Recap: Litecoin (LTC)
Hello Crypto Lovers! Big bullish breakout today in Litecoin so that will be the focus today!
Recent news of Charlie Lee leaving Coinbase and coming back to work full time on the Litecoin project has gotten the energy back into Litecoin. I’m here to provide some guidance looking forward and find anything interesting on the chart such as where to buy, where to expect some selling, how to recognize when a trend is ending, and where the more active traders might want to make tactical moves.
Let’s jump in!
Quick Take:
As of 18:00 on June 17th, 2017 (GMT+6 hours)Price: $44.16
$USD 24 hour change: +32.19%
$USD Weekly change: +50.87%
LTC/USD Daily Chart
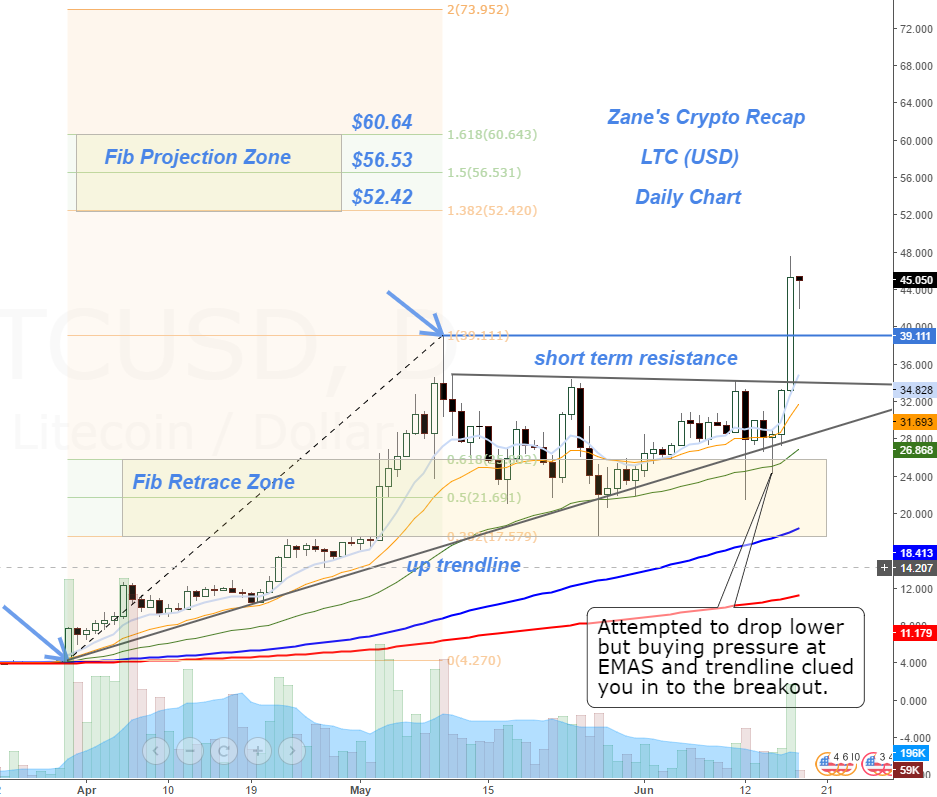
For a bull trend that looked to be slowing down it has awoken with exuberance today.
The move was kicked off by the attempts to drop below the 50EMA but aggressive buying lifted the price to recapture the faster moving 10 and 20EMA’s each time the trend tried to breakdown.
As I have mentioned earlier, after strong bullish trend thrust, prices need to rest and digest the move. Stronger trends bounce off the 20 and 50 EMA and don’t let the price stay below them for very long. If it does then the immediate trend officially breaks down. Lucky for us, there is no trend breakdown in sight.
Let’s find some new targets using Fib’s:
$52.42 is the 138.2% fib level
$56.53 is the 150.0% fib level
$60.64 is the 161.8% fib level
Downside concern:
Simply put, not much at all right now. Just be careful buying in when price is this extended because you risk pullbacks into the level we just broke out of, which could be up to a 20% retracement if you chased the entry to $44.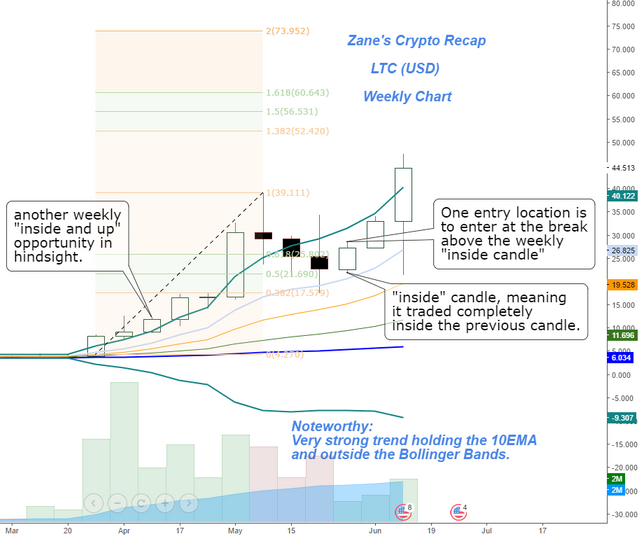
Hope all you Steemians enjoyed this recap!
Stay Tuned and upvote if you would like to see more Crypto Recaps.
What’s on the Chart?
Light Blue = 10 Exponential Moving Avg
Orange = 20 Exponential Moving Avg
Green = 50 Exponential Moving Avg
Thick Blue = 100 Simple Moving Avg
Thick Red = 200 Simple Moving Avg
Horizontal lines = Support/Resistance areas
What’s Next on Zane’s Crypto Recap?
I plan on releasing a detailed chart each day on a rotating schedule. I will alternate between STEEM, ETH, BTC, LTC, possibly DASH or other Top coins with big time action.
I want to provide you with levels to trade around, perspective to read the charts so you don't get scared on what looks like a big 1 day selloff only to have it recover the next day, and to also meet other like-minded people as myself so we can grow and benefit together.
Remember, I will include in the rotation the most requested coin in the comments below.
Let me know what coin you would like to see next and let’s get prepared to analyze and trade it properly together.
Request your favorite coin in the comments now!
See you tomorrow,
Zane
Loved this post, voted, following & resteemed.
Thanks @toadslinger. So glad you liked it!
Another awesome post @inzan1ty! Keep em coming!