ETH/BTC/LTC updates and outlooks 02/09/18
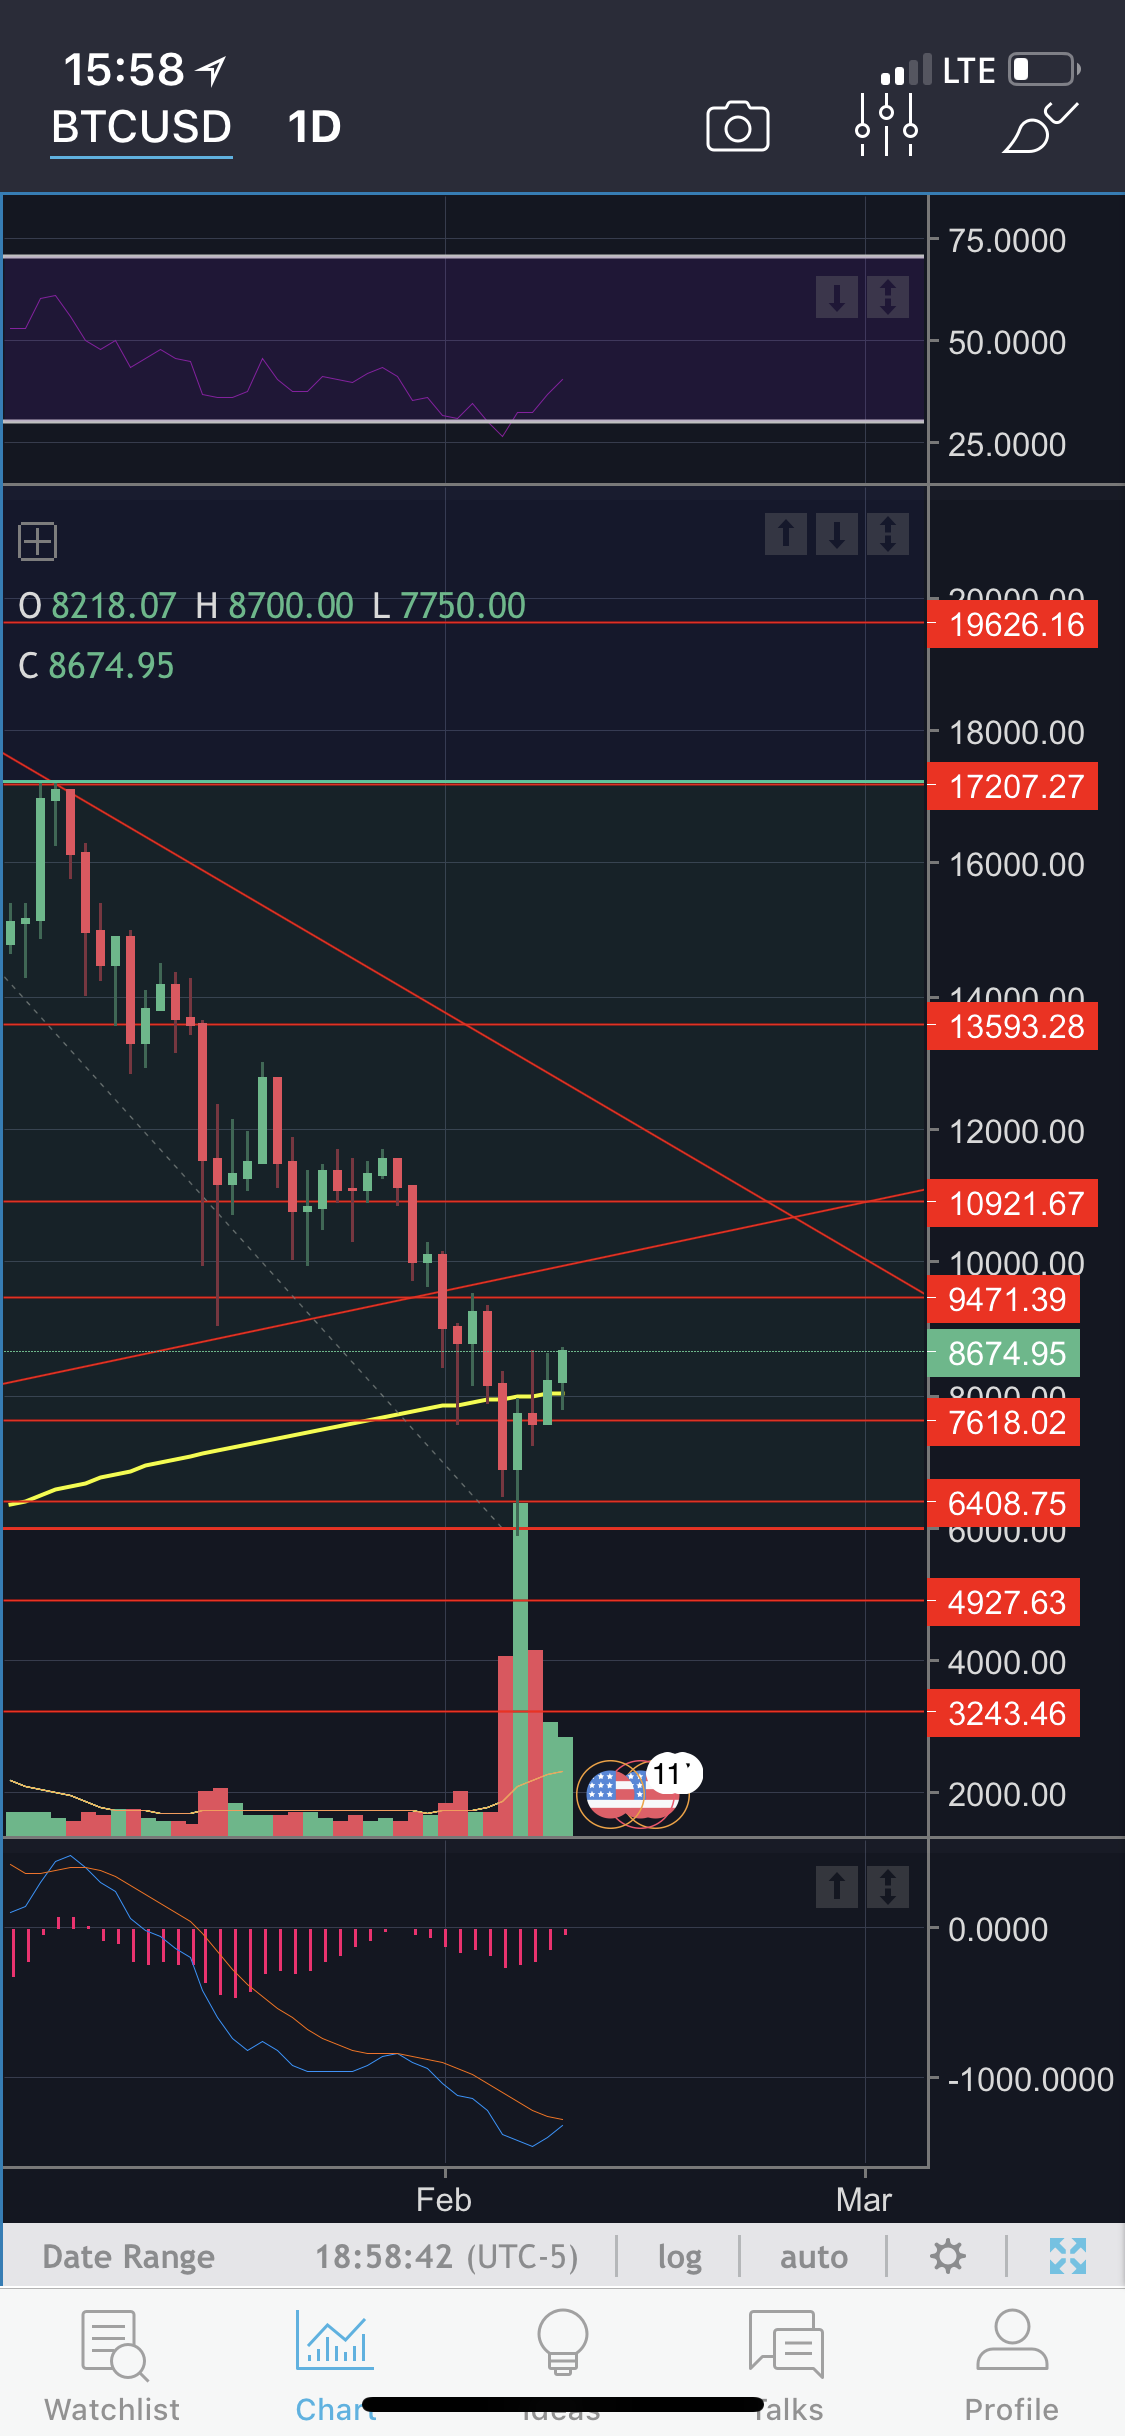
Today Bitcoin, litecoin, and ethereum have all seem decent volumes with the price movement upwards. Bitcoin has been moving upwards in price since the bottom out at 5800~ the daily volume allows the price to keep moving up and the MACD histogram on the daily chart is showing a momentum. RSI bounced off the oversold area. Currently the problem area would be around 9471. Bitcoin needs to break this key level to continue and break the downtrend.
The volume from two days ago seems like it's pushing it and following the move.
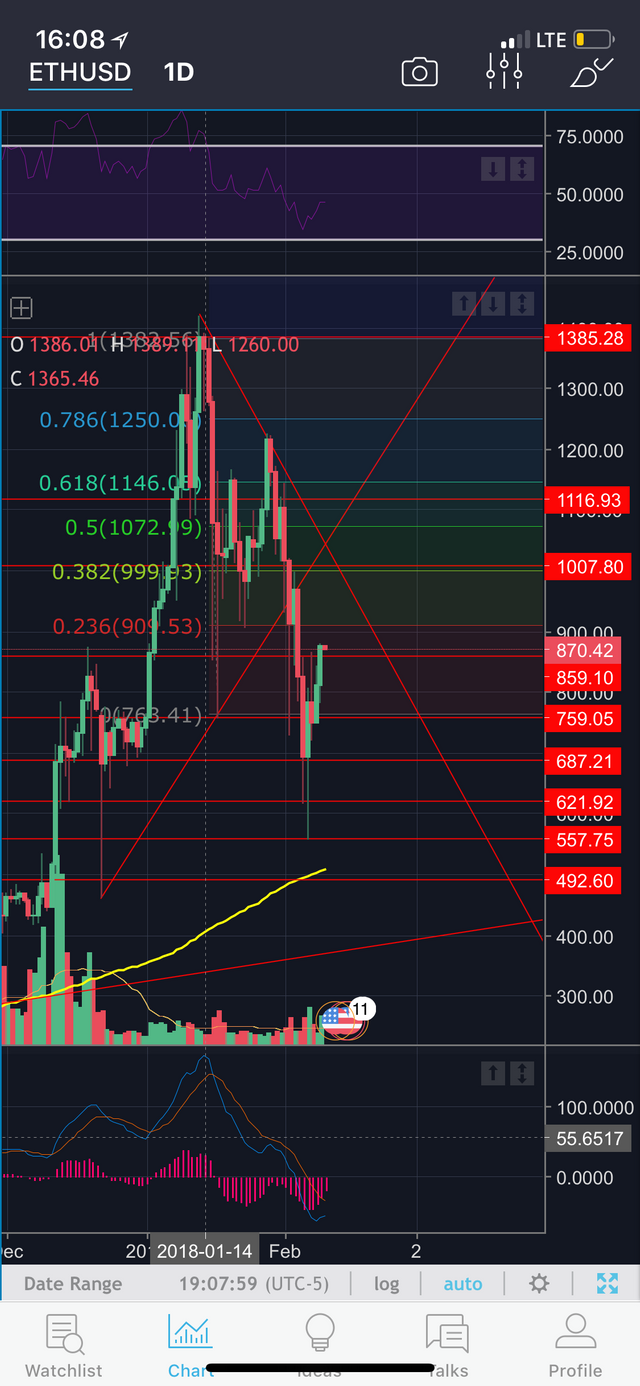
Ethereum is in the same boat as Bitcoin and had a decent amount of volume following the bottom of eth. On 02/06/18 the volume topped most of the volume since the move down from the all time high. MACD histogram has been following price movement so nothing to worry about currently on the daily chart. RSI popped off the bottom where it was oversold a couple of days ago. Ethereum has broken though a key resistance area of 859~ with a solid daily candle, and now ethereum needs to continue to 1007~ in order to break the downtrend
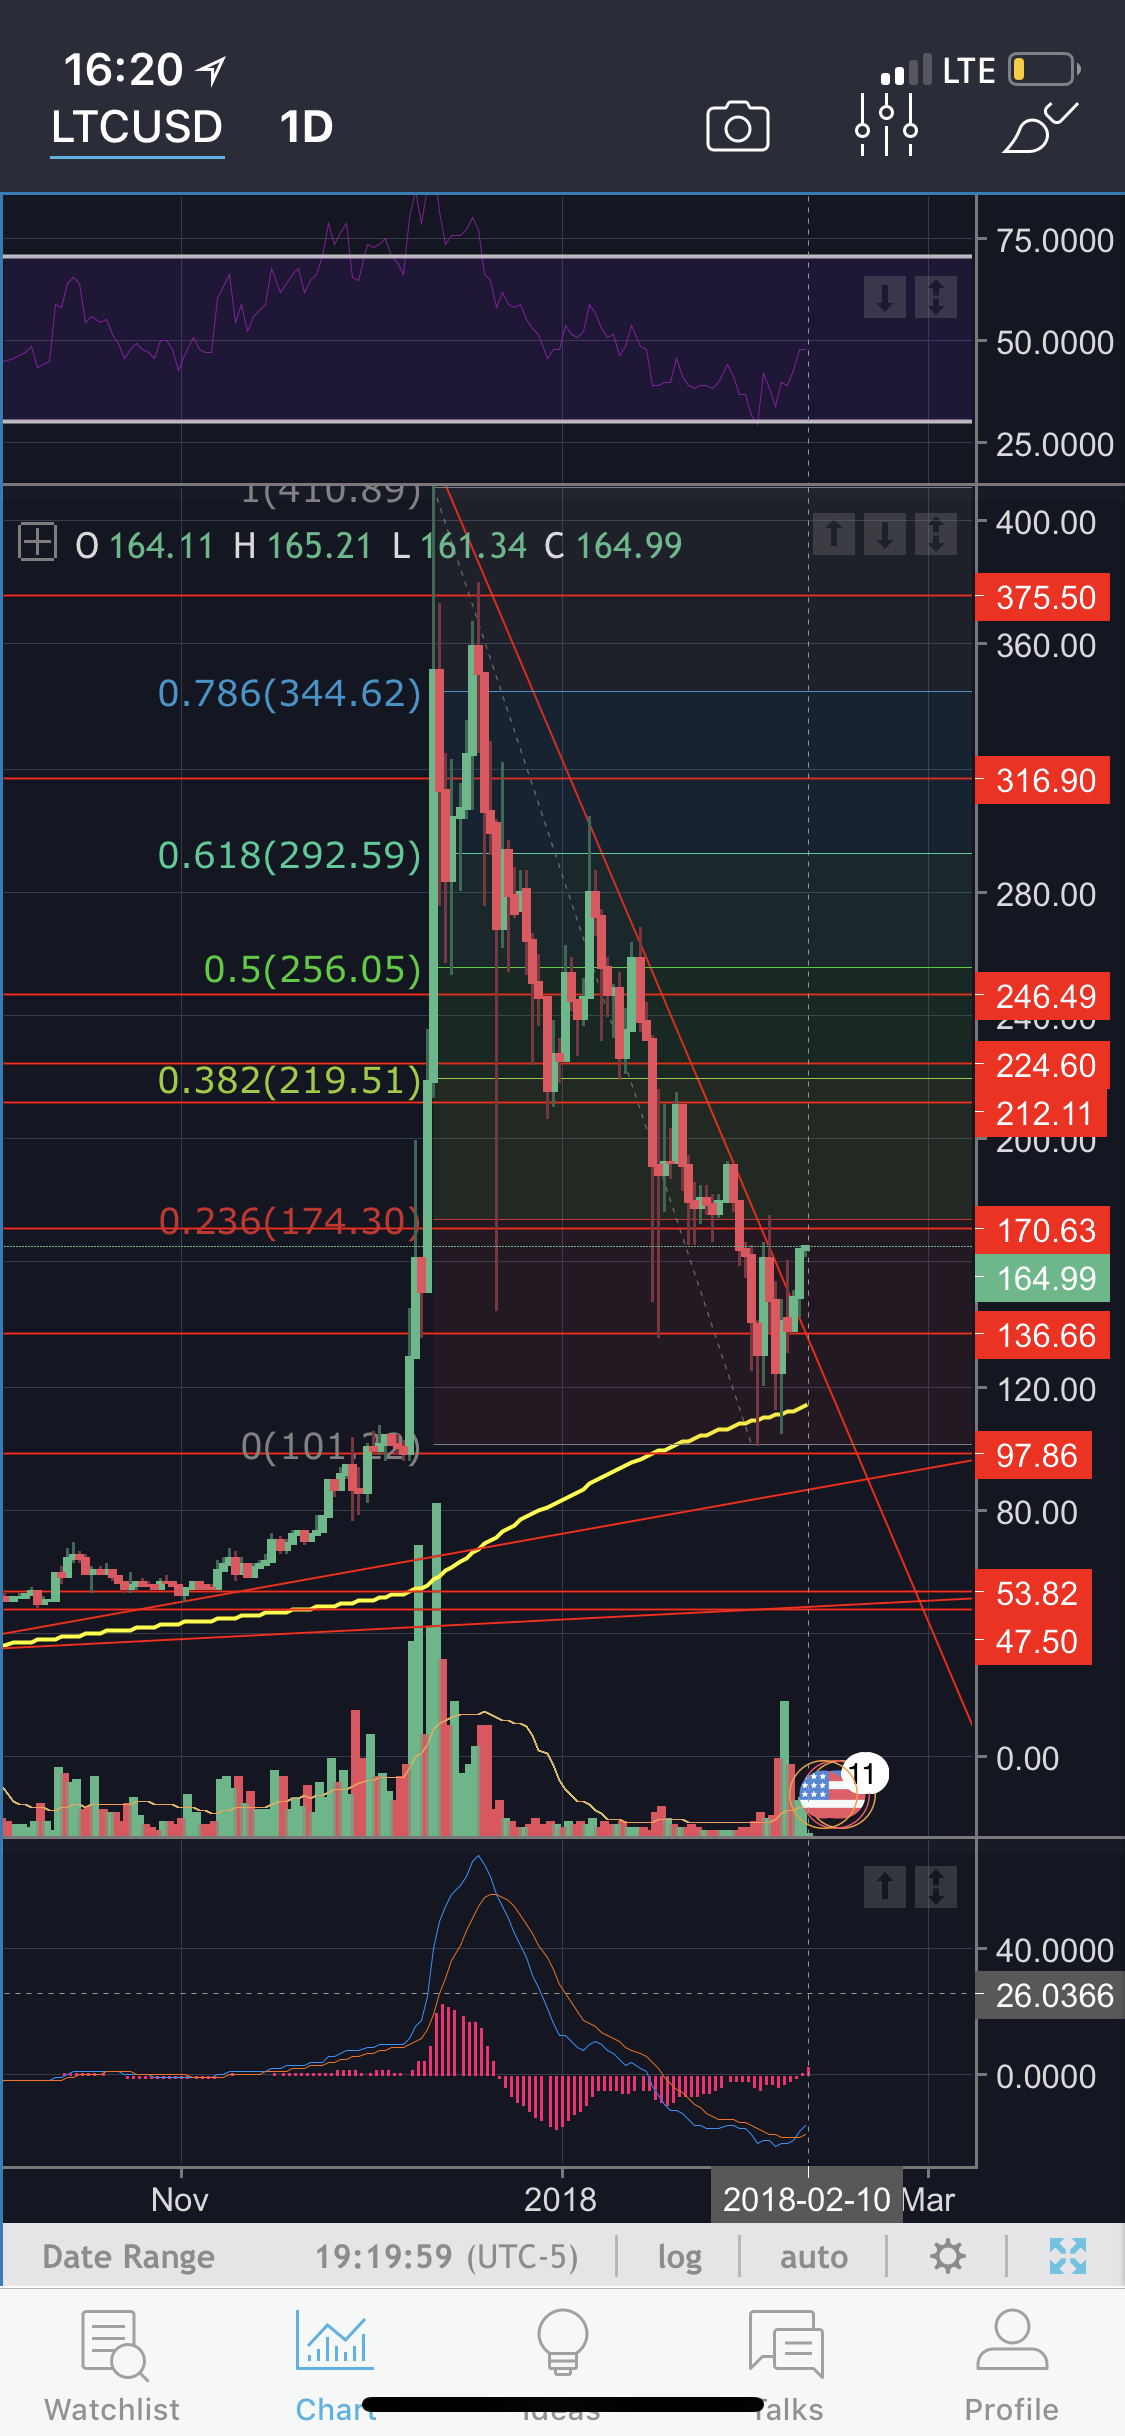
Litecoin is also following the pattern of breaking through. I believe litecoin has a better chance of following through with a upwards movement in price. Litecoin's MACD histogram has been diverging for at least a week on the daily chart. The massive amount of volume on the 6th of February 2018 has given litecoin the push it needed to continue and keep momentum for the break of the daily down trend. The official break of the daily downtrend occured on the 8th of February with a solid green, bullish candle. Litecoin used the 200 MA of the daily chart as a heavy support area. 170~ is going to be a resistance area that turned from support. Then the next areas would be 212-246~ The ultimate test would be to break the 61.8% retracement area which is resting at 292~ The long term outlook, I mean months from now is bullish, for all the big 3. But currently, short term is bullish with medium term more bearish because of all the resistance areas.
Disclaimer: This is my, Lee's Investment, own analysis of the CryptoCurrency chart(s). These are not to be taken as Certified Financial Advisor positions. Take these trades at your own risk. Lee's Investment, is not a certified advisory firm, and is only providing information for educational purposes. You are required to perform your own due diligence to take these trades. You should always check with your licensed financial advisor and tax advisor to determine the suitability of any investment.