Litecoin / U.S. Dollar -Update-
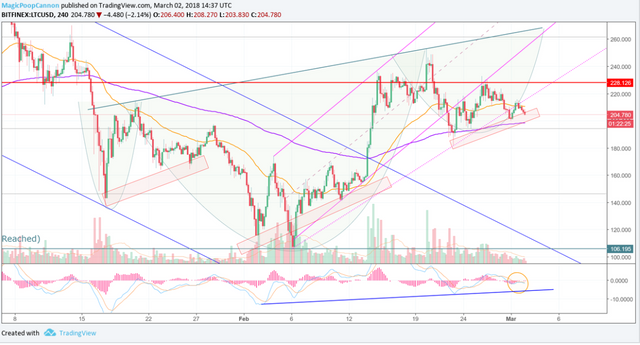
Hi friends, welcome to this update on Litecoin! Let's get right to it! Looking at the four hour chart, you can see that LTC has moved in a way that has caused me to disregard the bull flag . It actually appears to be building a head and shoulders pattern, in the right shoulder. However, I've noticed that this same sort of rising support has been found in the left shoulder and the head, as indicated by the red diagonal boxes. So, perhaps LTC will find support here, possibly on the 200 EMA . If the 200 EMA , and the 61.8% retrace (about 194.30) are lost, that would be a bearish development, which could initiate some selling pressure. However, that is not yet the case. Currently, we can see that LTC is continuing to find rising support, as it fills the right shoulder of this potential inverse head and shoulders pattern. We need to pay close attention here, however, because the pattern in the right shoulder is starting to look a bit bearish . This uncertainty, and mixed price action, is why I have been saying that (for educational purposes) it is best to be on the sidelines right now. A confirmed, sustained breakout, above the 50% retrace, around 228, would be a bullish buy signal.
Overall, the right shoulder is continuing to fill, but we're getting some mixed signals. The safety of cash is the best place to be right now, as uncertainty remains as to whether or not LTC will fall below the 618, or break above the 50% retrace. You can see that we're back below the 50 EMA (in orange) and we appear to have just been rejected at the bottom of the rising pink dotted trendline . So, as I've said, this recent price action does look a bit negative, and we need to pay close attention to the aforementioned levels. We are still forming higher highs, but if LTC begins to test the 200 EMA , be aware that a breakdown may ensue. That doesn't necessarily mean that the inverse head and shoulders would be invalidated, but it would be a cause for reevaluation. Regardless, the inverse head and shoulders pattern is still the primary focus, and it is indicative of higher prices in the near future. The MACD looks weak, and volume has been on a sustained decline, as an increasing amount of traders sidestep this mixed price action.
$LTC has alot more steam left