LTC?! Not Catching up with the Fresh Bullish Market Yet!
While Most of the High Market Cap Alts seems to have started a new bullish uptrend, LTC seems to be lagging! As a matter of fact it still seems like its in a downtrend! Here is what the Weekly and Daily Charts are telling us!
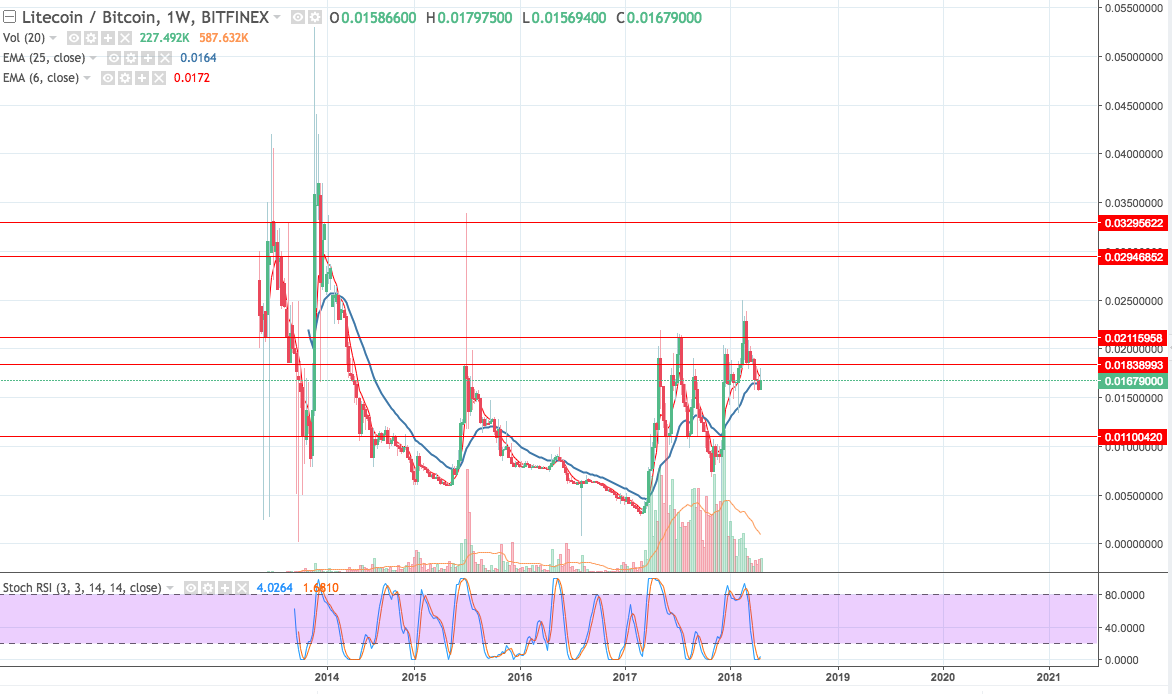
On the Weekly Chart: The Strong range between 0.02115 and 0.0110 still seems to be prominent! Stochastic indicator on the weekly is stil in the oversold zone with a flat angle indicating no signs of reversal yet! Add to that price is trading below fast moving average and seems to be taking a troll down to below the slow moving average to test the 0.0110 again!
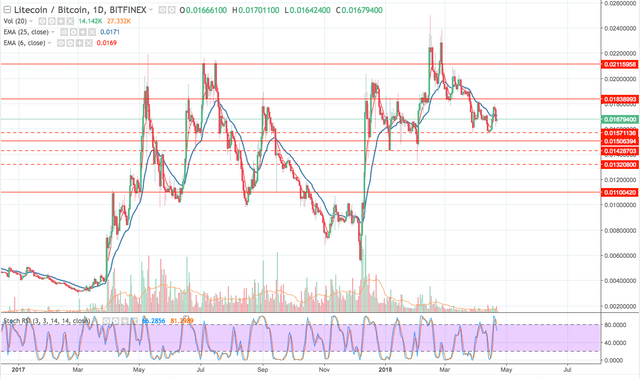
On the Daily Chart: things aren't looking better either! As a matter of fact, Daily chart sort of confirms a downtrend for LTC. Despite the fact that there is a strong support at 0.01506 , stochastic indicator on the daily chart suggests that the price is overbought and is moving downward to the stochastic no-man's zone with a steep angle! If price didnt find strong support at 0.01506, it could just continue the weekly range referred to earlier!
Personally, I would wait for a confirmed uptrend before going into LTC, but form what the charts are saying, its not happening anytime soon!
Congratulations @cryptospective! You have completed some achievement on Steemit and have been rewarded with new badge(s) :
Click on any badge to view your own Board of Honor on SteemitBoard.
For more information about SteemitBoard, click here
If you no longer want to receive notifications, reply to this comment with the word
STOP