Zindi Fowl Escapades challenge: EDA of audio data in R
This is my first contribution to the Zindi community. While I much prefer Python to R, I haven't worked in R in a while and someone on the forums requested R starter code.
- Have a look at my github repo here, Fowl Escapades R code. It's still a work in progress, so things may change frequently.
- For starter code in Python, see Fowl Escapades Quickie.
- For starter code in R, subscribe for my following posts. Sorry for the cliffhanger. If you really can't wait, try building your own machine learning model in R.
What is the purpose of the Zindi Fowl Escapades challenge?
The goal of this challenge is to identify birds by their calls.
Get the data
Doing this in R:
Install the required packages
For this exercise, I am using av. This is an R wrapper for the famous ffmpeg. You can also have a look at signal, which is what I'd used initially, but av will do.
# install if needed
install.packages("av")
# import regardless
library("av")
Download and extract the data.
This is needed if you want to perform EDA on the rest of the data. Note that my EDA code in the repo contains only a single file from the dataset because I don't want to put more than a gig of data on my poor github repo.
Load the data
I made a separate csv file which references a handful of audio samples. This doesn't do much, it's just to show how this is done in R if you need the background.
# This dataset is for illustrative purposes only
file_name <- "./csv/EDASamples.csv"
eda_samples <- read.csv(file_name)

# peek inside
dim(eda_samples)

# check for null values. decide what to do with them at this point
table(is.na(eda_samples))
EDA on Audio
Prerequisite domain knowledge
What makes this challenge more challenging is that the data provided is audio data. Audio data presents its own set of headaches, and Audio Signal Processing (ASP) is a specialised field with its own idiosyncrasies. If you desire a more solid background in this field, here are some helpful resources:
- For more than you ever need to know but a brilliant guide nonetheless, have a look at DSP Guide. It is superb. Like over 9000. At least 5/7.
- For Digital Signal Processing (DSP) in general, Think DSP is a great resource.
- For ASP in particular, see this ASP Basics tutorial.
- For ASP in R, RTFM of the signal package. I opted for the av package, because it's more directly related to audio and video processing.
How does one approach EDA on audio data?
Broadly speaking, one can look at audio data in the time domain, or in the frequency domain, or somewhere in between by plotting frequency over time. Disclaimer: engineers out there, please don't cringe too much at the terminology applied here. It is outside the scope of this humble blog post to summon the hobgoblins of consistency. I am merely providing a quick and dirty starting point for fellow noobs. Feel free to admonish me in the comments, though.
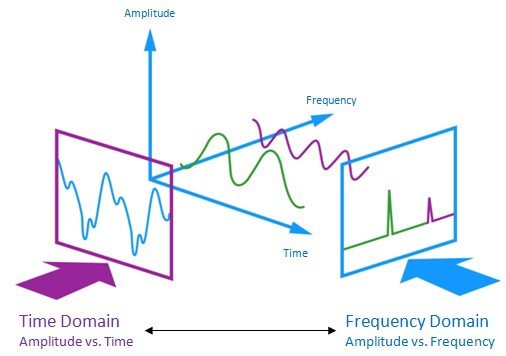
In the time domain, you see how amplitude changes over time. This is how you normally listen to songs: The different parts become louder and softer during the duration of the song.
The frequency domain is different. It's like a snapshot of all the frequencies at once. In the frequency domain, you can check which frequencies occur in the entire sample, and which ones do not occur. If you listen to this, you'd hear all the present frequencies simultaneously, like a death shriek chord.
You switch between the time domain and the frequency domain by means of Fourier Analysis. The Twilight Zone part about this is if you performed Fourier Analysis on the same data in the frequency domain, you get your song back in the time domain. If you can explain how this works, they might burn you at the stake, so beware.
Audio signals such as speech and music and bird calls differ quite a bit in terms of frequencies over time, so they are best dealt with by means of time-frequency analysis.
Now that the engineers have had their coronaries, let's do the EDA!
EDA in the time domain
Here we plot the waveform of the first bird call in R. What you see here are amplitudes of the signal as they change over time.
# read 3 sec of audio samples and plot
pcm_data <- read_audio_bin(audio_file, channels = 1, end_time = 3.0)
plot(pcm_data, type = 'l')
Let's have a look at some metrics.
summary(pcm_data)
Min. 1st Qu. Median Mean 3rd Qu. Max.
-447440384 -25043493 -32 -282 25092068 401621440
While you can obtain plenty of statistical information in the time domain, it's cumbersome to work with audio like this. You'll have far more options if you work with audio in the time-frequency domain.
EDA in the time-frequency domain
To see how the frequencies change over time, you perform a Short-time Fourier Transform (STFT) on the audio file.
Let's do an STFT on our bird call file to plot a spectrogram. There are various ways to plot the spectrogram in R, but this is the av way.
# read 3 sec of data and directly transform to frequency, then plot
fft_data <- read_audio_fft(audio_file, end_time = 3.0)
plot(fft_data)
Note that this is frequency over time, but now you can see a heat map of the different frequencies. There is more information about time and frequency domains on the ASP tutorial, in a matlab style of processing.
Windows and tapering in the time of Corona virus
Once you get hold of the frequencies, you can apply plenty of filters and windows to your audio data. Have a look at the signal R documentation for more ideas. You may need more fancy packages for inputs into your classification models, but that's another post. Music feature extraction in Python provides some inspiration in this regard.
By eyeballing the spectrograms, you can already see that some frequencies are very high, some are very low, and therefore they are probably background noise and not related to the actual bird calls. You can apply some filters to get rid of plenty of unnecessary information. The package av only provides a few windowing functions, so it serves our purposes here as an initial EDA well, but something more hardcore like signal may be required for the competition.
Conclusion
In this post, I provided an R repo with rudimental EDA for audio data. I provided a few helpful resources for background domain knowledge, and I offered a brief explanation of the methods applied in my R code. Finally, I gave some tips on methods you could use to obtain data for your models in the Zindi Fowl Escapades challenge. Good luck!