Bitcoin Price Crashed.
Bitcoin price crashed history from 2011 to 2018.
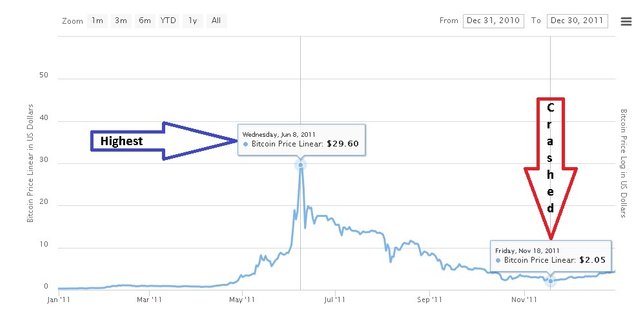
2011
Highest price = $ 29.60
crashed = $ 2.05
(93.07% Down)
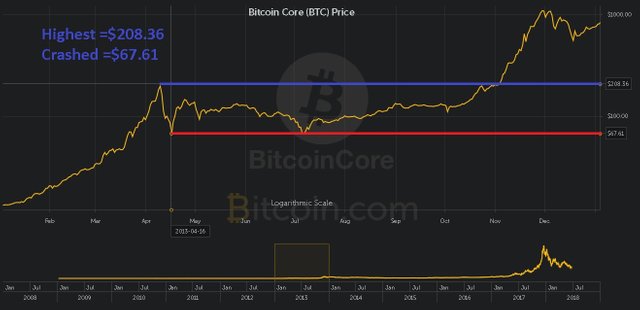
2013
Highest price = $ 208.36
Crashed = $ 67.61
(67.55% Down)
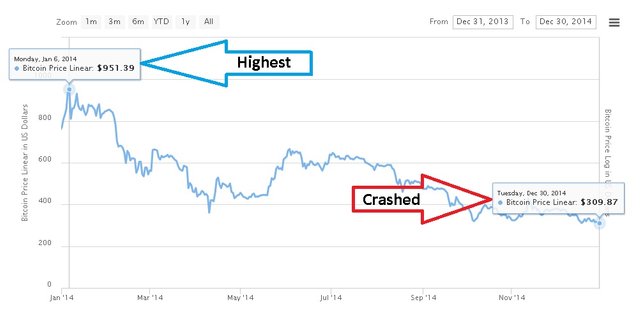
2014
Highest price = $ 951.39
Crashed = $ 309.87
(67.42% Down)
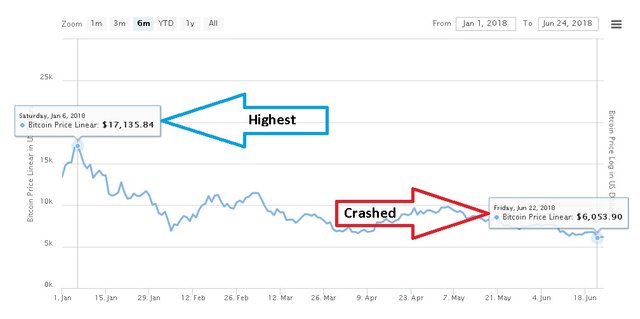
2018
Highest price = $ 17135.83
Crashed = $ 6053.90
(64.67% Down)
Hopping price in 2-3 years.

So as per we always see the price of Bitcoin is not stable but the growth rate is relatively very high as compared to the downfall rate. In my personal opinion if you want to take a risk and want to make more profit in a less amount of time than definitely Bitcoin investment is a good source of investment. Moreover, 80% traders of Bitcoins always gain some amount of profit.
The traders who are beginners and just started in this field there are chances of 20% that they might lose the amount of investment due to the unstable nature of Bitcoin making fear in the beginner’s trade.
So that’s all for the Bitcoin Price history chart. I hope this post will help you to gain all the information about Bitcoin history and its price.
If you are still facing some difficulties then please let me know in the comment section. Also, please like and share this post with your friends and family.
This means now bitcoin is at rick bottom and from here will see a rally. But during last falls in bitcoin their was no futures in crypto currency which is the major reason of fall. What do think about this
Why you think that no future in cruption currency ?
And i am describe the major reason of fall in my next post.
Yeah bro thanks to inform and it is really a biggest risky for new crypto traders