2014 vs 2018 Bitcoin Price Correction
2014 and 2018 is Very Similar
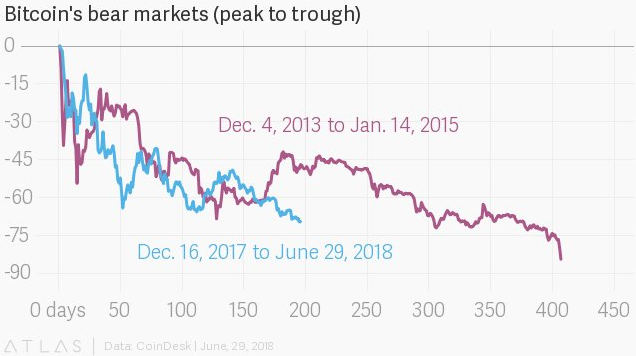
From December 4, 2013, to January 4, 2015, in a 400-day period, the bitcoin price dropped by over 80 percent, recording the worst correction in its history. The mid-term decline in the price of bitcoin was prolonged by a four-month period during which BTC rebounded to its previous support level and remained above that level before inevitably falling by more than 80 percent.
( )
)
In 2014, it took bitcoin 300 days to drop by more than 70 percent. In 2018, it took BTC less than 200 days to decline by over 72 percent and in contrast to its correction in 2014, BTC is falling significantly faster than it did four years ago.
If the price chart of bitcoin year-to-date is compared with the price chart of bitcoin from December, 2013 to January, 2015, with the chart of BTC from 2013 to 2015 compressed, the price trend of BTC seem nearly identical to its price trend in 2014 with one key difference: speed.
Purely based on the price trend of BTC year-to-date and the price trend of BTC in 2014, BTC is experiencing a faster version of the 2014 correction. It has experienced similar drops and corrective rallies in similar timing, and it is now on track to decline further to bottom out at a stable region.
If the chart of bitcoin year-to-date and the compressed chart of BTC in 2014 are compared as seen below, many similarities can be detected...
( )
)
Shorter Correction
As BitMEX CEO Arthur Hayes said during his interview with CNBC Fast Trader on June 30, it is possible that bitcoin bottoms out in the range of $3,000 to $5,000, and experience an 80 percent+ correction.
“Absolutely [BTC can reach $50,000 by 2018]. I think something [bitcoin] that goes up to $20,000 in one year can have a correction down to $6,000. I think we can find a bottom in the $3,000 to $5,000 range, but we are one positive regulatory decision away, maybe an ETF approved by the SEC, to climbing through $20,000 and even to $50,000 by the end of 2018,” said Hayes
Given that bitcoin has experienced the 2014 correction in almost a fast-forwarded fashion, it is highly likely that the correction of BTC in 2018, considering the difference in market conditions and regulatory state of the industry, ends significantly faster than the correction in 2014.
Moreover, as Hayes said, an unforeseen regulatory change by the US government or any other leading cryptocurrency market could lead the price of BTC and other major digital assets to recover with strong momentum and demand, especially if an ETF or a publicly tradable instrument is launched in the U.S. financial market.![Untitled.jpg]
Featured image from Shutterstock.
interesting ... the increase in the speed with which the graph of 2018 was developed, is by the largest number of participants in the market crypto, the interesting thing is that from 2014 to 2018, went from 1k to 20k, the question is if this time we will see a new parabolic or exponential upward movement, similar to the one already seen ...
regards
Thanks you