Model Madness 2019 - Elo Ratings
The Elo Rating System is one of the most popular rating systems used out there. Traditionally associated with chess, many models in varying sports and games use some variation of the Elo. So, today, we're going to play a little with the Elo, discover how it works and why it works, and then discuss the pros and cons about using basic Elo Ratings for college basketball.

The Elo Rating System was developed and implemented in 1960 to rate chess players by physics professor and chess player Arpad Elo. An alternative chess rating system, the Harkness System, had been in place for 10 years prior to the Elo being implemented for the US Chess Federation. It is still used to this day due to its computational simplicity and its perception as an accurate and fair ranking system.
The Elo Ratings focus on using normal distributions and probability as a means of determining of the likelihood of one player beating another. The key idea in the model is that on any day, any player could beat any other player, but given differences in skill the probability of each player winning differs.
If two players have the same score, they both have the same probability of winning the game, 50%. If one player has a higher score, then they are more likely to win the game, but the player with a lower still has a chance to win. The better player may play down to the level of the lesser player, or the lesser player play up to the level of the better player, or some mixture of the two in the occasion of an upset.
The first formula takes a logistic curve, which is the cumulative distribution function of the logistic family of distributions. This family of distributions "resemble" normal distributions but tend to have fatter tails. In non-statistical speak, there is a little more room for more extreme results (upsets) than you would expect with a typical bell curve. The two equations below are probabilities that express this first formula from the perspective of each player:
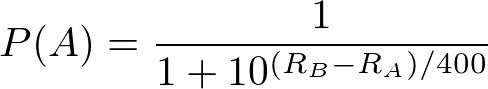
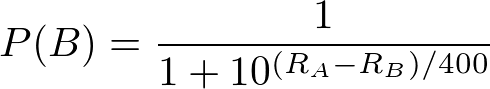
If you know anything about probability theory, you recognize that these two probabilities add up to 1. R(A) represents the rating of Player A and R(B) represents the rating of Player B. If both players have the same score, we can easily verify that both players have even odds of winning the game or match.
Probabilities are nice as a means of predicting a match, but as we saw last time with the EDM Rating, we need to be able to update scores as we get more games played in order for the rating to be accurate. We update by taking the actual result and subtracting the expected result and multiplying by some coefficient K. This value is added to the old rating to get the new rating. We can see this equation below:

A is the actual result (either 1 for a win or 0 for a loss) and E is the expected result (the probability listed above). This means that higher ranked players have more to lose since they are more likely to win. But given an infinite sample size, these larger losses are compensated by the fact that in the long run if their score is truly reflective of their skill, then they should win more games given similar rated opponents.
To sum everything up and drive home the Elo Rating System, we'll go over an example. Let's say Player A has an Elo Rating of 1800 and Player B has an Elo Rating of 1400. If we plug the ratings into the respective equations for the first formulas, we can see that Player A has an expected score of 10/11 (90.9%) and Player B has an expected score of 1/11 (9.1%).
Player A is heavily favored to win. Let say Player A does win. Using a value of 10 for K, we get an updated value of 1801 for Player A and an updated value of 1399 for Player B. If Player B wins, Player B's updated score is 1409 and Player A's updated score is 1791.
Overall, the Elo Rating system is a simple yet solid representation of an individual's representative skill at any moment of time. The issue is how well it translates to team sports. Because over time, teams change, where an individual is still the same person although they might have improved or gotten worse. This model is okay for sports where the player turnover and movement is lower, but for a sport like college basketball, the rating system across seasons can run into issues due to the four year careers of most student athletes and the even shorter careers of the best players.
You can limit the Elo Rating to a single year, but the low sample size of the regular season doesn't really give you a lot to work with. To demonstrate these limitations, we'll run the Elo Ratings starting with all teams at 1500 (like you would with chess) and use a relatively high Elo Rating (K = 32). We'll show the top 25 teams and look at some patterns and deviations from what we normally might expect. These ratings are up to date as of the morning of March 1, 2019.
| # | Team | Record | Elo Rating |
|---|---|---|---|
| 1 | Houston | 27-1 | 1778.870 |
| 2 | Gonzaga | 28-2 | 1768.757 |
| 3 | Virginia | 25-2 | 1760.677 |
| 4 | Kentucky | 24-4 | 1742.571 |
| 5 | North Carolina | 23-5 | 1737.119 |
| 6 | Duke | 24-4 | 1732.479 |
| 7 | Nevada | 26-2 | 1728.813 |
| 8 | Cincinnati | 24-4 | 1727.249 |
| 9 | Tennessee | 24-3 | 1724.739 |
| 10 | LSU | 23-5 | 1717.993 |
| 11 | Buffalo | 24-3 | 1717.051 |
| 12 | Michigan State | 23-5 | 1712.462 |
| 13 | Marquette | 23-5 | 1709.743 |
| 14 | New Mexico State | 23-4 | 1707.399 |
| 15 | Wofford | 22-4 | 1704.832 |
| 16 | Michigan | 25-4 | 1703.996 |
| 17 | Texas Tech | 23-5 | 1702.609 |
| 18 | Purdue | 21-7 | 1689.579 |
| 19 | VCU | 22-6 | 1682.255 |
| 20 | Florida State | 22-6 | 1679.558 |
| 21 | Old Dominion | 23-6 | 1677.220 |
| 22 | Virginia Tech | 22-6 | 1673.850 |
| 23 | UCF | 21-6 | 1672.280 |
| 24 | Belmont | 23-4 | 1672.280 |
| 25 | UC Irvine | 23-5 | 1669.492 |
The big surprise on this list is seeing Houston top the list where the EDM Rating and AP Poll both had Houston outside the Top 5. A lot of this can be attributed to the fact that this model doesn't take into account the margin of victory. Gonzaga has pretty much decimated their competition but a large win counts the same as a small win in the model. Which over time could eventually even out as closer games tend to lead to more variance in results, but a team that is lucky can easily be overrated and luck can play a factor when the sample size is less than 30.
You'll also notice that there are not a lot of teams with a lot of losses. The team with the most losses is Purdue that are on a hot streak against strong competition. A lot of teams from small conferences make appearances such as New Mexico State, Wofford, Old Dominion, Belmont, and UC Irvine. They show up due to the fact they have very few losses and the losses they do have aren't to mediocre competition.
But overall, this model is a great model to use as a reference when comparing new models against. Although there are clear weaknesses, it still does a pretty good job of finding the best teams only using wins and losses which is even less information than the EDM Rating.
Next time, we'll build another model and soon after, we'll start using these models in conference tourneys over the next two weeks to evaluate some strengths and weaknesses in the models to analyze any patterns and continue building after learning from them. Anyways, I'll stop rambling. Thanks for reading.
Interesting topic, good article. What I would like to see is some explanation of why 400 constant and not 300 or 422. why K = 10 or 32.
The second part of the article is a bit of an abstraction to me, as I know little to nothing about American basketball.
Also, if team ranked at the bottom as 25th has a record 23:5 - who is loosing? I would rather expect 5:23 for the bottom team.I see, top 25 teams, must be a giant league!Chess uses the constant of 400 based on a suggestion by Elo that a difference of 200 between players should correspond with an expected score of 0.75 for the better player. 400 is a round number that achieves a value close to that (.76). Other than that preference it looks like that constant is rather arbitrary.
In American college basketball, there are 353 Division 1 Basketball teams that play approximately 30 games each year prior to postseason tournaments. Each team belongs to a conference which acts as a league where teams in a similar geographic area play against each other. There are 32 conferences in Division 1 basketball. So, yeah college basketball has a lot of teams because it isn't a traditional league, but a group of 32 "leagues" where the teams that all play against each other in the first half of the season and then play within their conference the second half of the season.
Elo is a very elegant model and it's a shame it doesn't work for the team sports.
I enjoy this series of yours, keep it coming.
Posted using Partiko Android
It does a decent enough jobs for team sports, but it definitely works better at the individual level.