Model Madness 2019 - Margin Adjusted SPM
Now that we have a small collection of models, we can give one of them a little upgrade. Last time, I introduced the schedule plus-minus which looked at a team's resume and determined a team's quality based on how strong the teams they beat were and how weak teams they lost to were. Well, this time we take take that model up a notch and add information to it.

The schedule plus-minus model does a good job of describing an overall resume, but it lacks important information about how one team defeats another team. We currently define the strength and weakness of teams by solely wins and losses. A win by 20 is the same as a win by 1 in the model. Ultimately wins are the only thing that matter in terms of building a good bracket, but perhaps "lucky" teams are hiding within the participant pool that have their luck run out in the tourney.
So, today, we're going to fix this aspect of the schedule plus-minus by adding an additional factor using the margin of victory to create a better metric that includes the margin which will do a better job of differentiating the dominant teams from the lucky teams. The previous post on schedule plus-minus describes how that model works in detail and the strengths and weaknesses of that model.
We could simply multiply the margin of victory by each team's addition for wins or subtraction for losses. But it doesn't make a lot of sense. Should a 40 point win count double that of a 20 point win? Both are dominant wins and the margin of victory doesn't matter as much. Should a 2 point win counts double that of a 1 point win? Perhaps, but both are still within a single possession and a victory within 5 points could have easily gone the other way given a few different bounces.
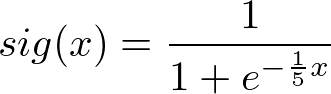
For our purposes, I'm going to use a logistic sigmoid function, dividing the margin by 5 before plugging it into the standard logistic sigmoid function. For anyone unfamiliar with a sigmoid function, it looks like the following:
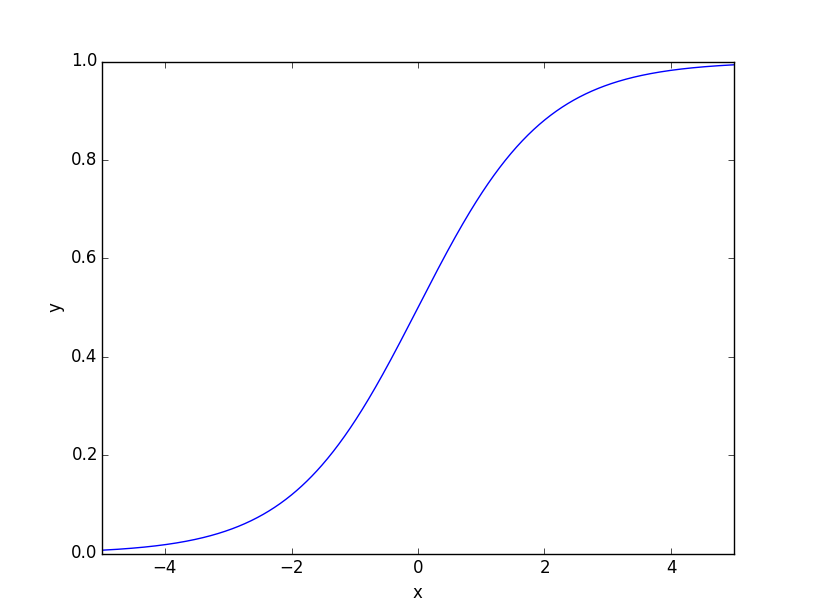
The greatest range of chance occurs when x = 0 and the slope decreases as x gets bigger. This works well for our model as we care less about the margin of victory as it grows larger and larger. The following equation shows the multiplier I'm using for this modified model:
The following table shows how different margins lead to different multipliers:
| x | sig(x) |
|---|---|
| 1 | 0.550 |
| 2 | 0.598 |
| 3 | 0.646 |
| 5 | 0.731 |
| 10 | 0.881 |
| 20 | 0.982 |
| 40 | 0.999 |
We can summarize the whole idea with an example. Let Team A have a 1-1 record and Team B have a 2-0 record. Team B has two 1 point wins over teams with a strength of 0.01. Team A has a 20 point win over a team with a strength of 0.1 and a 1 point loss over a team with a weakness of 0.01.
Team A's Rating = ((.982)(0.1) - (.550)(0.01)) / 2 = .0927
Team B's Rating = ((.550)(0.01) + (.550)(0.01)) / 2 = .0055
So, even though Team B is undefeated and Team A has a loss, Team B doesn't get as much credit since it has lucky wins over weaker teams, while Team A has a big win over a good team and an unlucky loss to a strong team. We'll call the following model the margin-adjusted SPM (MASPM).
Let's compare the Top 10 teams for the MASPM and see the similarities and differences between the SPM.
| # | Team | Record | MASPM | SPM Rank |
|---|---|---|---|---|
| 1 | Virginia | 27-2 | 0.2451 | 1 (0.2734) |
| 2 | Gonzaga | 29-2 | 0.2395 | 3 (0.2584) |
| 3 | Duke | 26-4 | 0.2382 | 2 (0.2671) |
| 4 | North Carolina | 25-5 | 0.2237 | 6 (0.2432) |
| 5 | Houston | 27-2 | 0.2229 | 4 (0.2546) |
| 6 | Tennessee | 26-3 | 0.2224 | 5 (.2476) |
| 7 | Michigan | 26-4 | 0.2152 | 8 (.2348) |
| 8 | Kentucky | 25-5 | 0.2132 | 7 (.2377) |
| 9 | Michigan State | 24-6 | 0.2011 | 14 (0.2101) |
| 10 | Buffalo | 26-3 | 0.2005 | 10 (0.2206) |
The two models are still fairly similar since both models use the same math for the most part to calculate the plus-minus metric. Houston is a little lower since they have had a few close games against inferior competition whereas Gonzaga rises despite the weaker competition simply due to their dominance. The biggest difference is Michigan State, who is 14th in the SPM. They had some really narrow losses to some middling teams, which drags them down in the SPM, but drags them down less in the MASPM simply because those narrow losses could be considered "unlucky".
Now that we have the MASPM to utilize, let's see which model selects to win another conference tournament. Today, we'll pick the MAAC. The first round just finished today, but the best teams already have a bye into the next round and we'll take a look at which teams have the best odds at winning.
| Seed | Team | EDM Rank | SPM Rank | MASPM Rank |
|---|---|---|---|---|
| 1 | Iona | 2 | 5 | 4 |
| 2 | Canisius | 5 | 4 | 5 |
| 3 | Quinnipiac | 1 | 2 | 2 |
| 4 | Rider | 3 | 1 | 1 |
| 5 | Siena | 4 | 3 | 3 |
The EDM model favors Quinnipiac who holds the 3 seed. The two SPM-based models both favor Rider who holds the 4-seed. It will be interesting to see if the seeds hold true or not, but this tournament looks like a potential toss-up given that the 3 and 4 seeds look the best to the model and there is no clear consensus on ordering among the three models. So there will potentially be some information to gain here.
Lastly, a quick update on how the models are doing with the conference tournaments so far. I have just started running the MASPM model so it is currently not in the grouping. Both models share a solid 16-3 record for games projected so far with both models having some issues trying to project the Northeast conference, with the models going 2-2 and the EDM losing it's champion in the first round (quarterfinals). So far the models are looking good, but they're not perfect... yet.
Projections (So Far):
| Conference | EDM | SPM | Actual |
|---|---|---|---|
| Atlantic Sun | Lipscomb | Lipscomb | TBD |
| Big South | Radford | Radford | TBD |
| Patriot | Colgate | Lehigh | TBD |
| Northeast | Saint Francis (PA) | TBD | |
| Ohio Valley | Belmont | Belmont | TBD |
| Record | 16-3 | 16-3 | Tied |