Model Madness 2019 - Schedule Plus-Minus
With the start of the Atlantic Sun conference earlier today, now starts the exciting part of March Madness. The games mean more and the teams which will be a part of the field of 68 in two weeks will come into clearer view. These smaller conference tournaments will be a good place to test our models in the wilderness and then see which models produce the best results.

Today, I'm going to introduce a model I developed to ranking old college football teams against each other, the schedule plus-minus. To anyone familiar with the plus-minus statistic in basketball, it takes a player or team's points for and then subtracts their points against. The schedule plus-minus is different but the idea is similar. Subtract a team's wins minus a team's losses. But here's the catch: Some wins and some losses count more than others.
When originally coming up with the SPM, I wanted to achieve the following four goals with the model in order to come up with a fair representation of skill while still awarding and valuing winning itself. Here are the four goals:
- Teams that win against strong teams deserve to be awarded greatly.
- Teams that win against weak teams deserve to be awarded, but to a lesser extent.
- Teams that lose against strong teams deserve to be punished, but to a lesser extent.
- Teams that lose against weak teams deserve to be punished greatly.
While this makes some sense in terms of evaluating teams, it begs the question: how does one determine a strong team from a weak team? Isn't that what we are trying to figure out in the first place? Yes, but what we are going to do is take a simplistic representation of team strength and then hope the aggregate (the plus-minus) gives us more useful data than these simple representations alone.
For the simple representation, we take an opponent's record and multiply by their opponent's cumulative record. The best teams by this metric will have both a high record themselves and a high record by their opponents. They are considered a strong team because their schedule is hard (opponent's cumulative record) and they still manage to perform well despite their opponents being strong by record as well. The worst teams by this metric will have a weak record against a weak schedule. The formula for determining a teams "strength" is shown below:
A fairly simple formula. We also have a similar formula that takes the compliment of each factor to calculate a team's weakness. A team has a greater weakness if their record is worse (yielding a higher complement) or their schedule is composed of a lot of teams with cumulatively weak records (also yielding a higher complement). This formula is shown below:

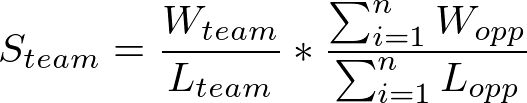
The plus-minus aspect of the model comes when we add strengths for each team that a particular team has beaten and we subtract strengths for each team that a particular team has lost to. We then divide by the number of games to get a team's schedule plus-minus. The components are pretty simple, but together we hope that the collective information is useful:

Let's give a quick example to illustrate this idea. Let's say Team A and Team B are both 1-1 and we want to decide which one is better using the SPM as the sole metric. Team A has lost to Team C who is 2-0 and beat Team D who is 1-1. Team B beat Team E who is 0-2 and lost to Team F who is 1-1. Let's assume that Teams C-F all have opponent's with a cumulative record of 2-2. We can calculate the strengths and weaknesses of the teams as the following:
| Team | Record | Opp Record | Strength | Weakness |
|---|---|---|---|---|
| C | 2-0 | 2-2 | .500 | .000 |
| D | 1-1 | 2-2 | .250 | .250 |
| E | 0-2 | 2-2 | .000 | .500 |
| F | 1-1 | 2-2 | .250 | .250 |
We can calculate the SPM for Team A by adding the strength of Team D and subtracting the strength of Team C and then dividing by 2 (for the number of games). We get a SPM rating of 0.125 for Team A. We can calculate the SPM for Team B by adding the strength of Team E and subtracting the weakness of Team F and then dividing by 2. We get a SPM rating of -0.125 for Team B.
Although both teams have the same record, by looking at their opponents, we can guess that Team A is probably a better team given their record than Team B. Team A has a better win by strength and a better loss by weakness than Team B. By summing these numbers in aggregate we can get a better picture of how a good a team is by their resume.
Typically good teams will have SPM ratings greater than 0 and bad teams will have SPM ratings less than 0 with most championship contending teams having a SPM between 0.2 and 0.3. Below are the Top 10 teams using the SPM for this season of college basketball and I'm sure you see some familiar names (up to date as of March 3):
| # | Team | Record | SPM |
|---|---|---|---|
| 1 | Virginia | 26-2 | .2703 |
| 2 | Duke | 25-4 | .2693 |
| 3 | Gonzaga | 29-2 | .2586 |
| 4 | Houston | 27-2 | .2543 |
| 5 | North Carolina | 24-5 | .2430 |
| 6 | Tennessee | 25-3 | .2412 |
| 7 | Michigan | 26-4 | .2351 |
| 8 | Kentucky | 24-5 | .2349 |
| 9 | Kansas | 22-7 | .2328 |
| 10 | LSU | 24-5 | .2305 |
Here we see Virginia take the top spot and Gonzaga at its lowest spot in any of the rankings we have seen so far. This is likely due to the weaker schedule that they play in the West Coast Conference. The other names we have seen in the Top 10 on prior accounts, but Kansas shows up in the Top 10 despite having seven losses. Given its tough schedule and its participation in one of the toughest conferences in college basketball, it makes sense to see Kansas here. This model is more accepting of Kansas recent losses due to the strength of their overall schedule than the EDM or Elo which have Kansas ranked lower.
Which leads us to the final point about the SPM. It does a good job of describing an overall record and resume, but lacks any perspective of recent performance. Even if you have lost the last five games, you still might have a decent SPM while your Elo and EDM Ratings take larger hits. You could argue that SPM and Elo are more adaptable to reason performance while also arguing that SPM is more resistant to noise. Given these two contracting styles of EDM and SPM it will be good to compare the two to see which works better for the tournament setting.
So, let's test our models on a Conference Tournament. Tomorrow starts the Big South Tournament. This conference has eleven teams that compete for the title, with the Top 5 seeds getting a first round bye. Below are the seedings for the tournament and their prospective EDM and SPM scores.
| Seed | Team | Record (Con. Record) | EDM | SPM |
|---|---|---|---|---|
| 1 | Campbell | 19-11 (12-4) | 1584.513 | 0.0108 |
| 2 | Radford | 20-10 (12-4) | 1762.894 | 0.0538 |
| 3 | Winthrop | 18-11 (10-6) | 1465.716 | 0.0087 |
| 4 | Gardner-Webb | 20-11 (10-6) | 1513.666 | 0.0048 |
| 5 | High Point | 16-14 (9-7) | 1316.606 | -0.0375 |
| 6 | Charleston Southern | 15-14 (9-7) | 1621.625 | -0.0423 |
| 7 | Presbyterian | 17-14 (9-7) | 1478.776 | -0.064 |
| 8 | Hampton | 14-15 (9-7) | 1577.377 | -0.0725 |
| 9 | Longwood | 15-16 (5-11) | 1036.625 | -0.1009 |
| 10 | UNC Asheville | 4-26 (2-14) | 372.676 | -0.2346 |
| 11 | USC Upstate | 6-25 (1-15) | 523.649 | -0.2405 |
Both rating schemes have Radford as the favorite to win the group and projects Radford to win the tournament. But it is interesting how the ratings system differ in terms of teams that are close together in seeding. Other the swapping the top 2 seeds, the SPM ranks teams by order of seed which makes some sense as more than half of each team's schedule is in conference play.
The EDM ratings vary significantly, with 6 seed Charleston Southern having the second best EDM of 1621.625. Winner of 7 of their last 10 and 4 of their last 5, Charleston Southern is a hot team with upset potential and the EDM even favors in their first match against 3 seed Winthrop in the second round. Also, if we look at EDM for the expected difference, the potential second round game of Hampton vs Campbell looks to be a toss-up despite Campbell being the 1 seed and Hampton being the 8.
In terms of building a bracket for this tourney, only one result differs, the potential second round matchup between Charleston Southern and Radford. EDM picks Charlestion Southern while SPM picks Winthrop. Both models project either team to lose to Radford in the semifinals.
We'll revisit this result in the future and see if the data gives us any new insights. The top 8 of the conference are fairly close so it wouldn't be a surprise to see any of them win the whole thing and lock a spot up in the NCAA tourney. Thanks for reading.
Additional Note: I'm also simulating other tourneys in the background and I'll post the records of the models for the matches. As much as I would like to post this data to the blockchain (to prove this results) in fancy tables (like above), I simply don't have the time to show everything, nor would I think it to be that interesting. As I mentioned, the Atlantic Sun Tourney started today and both models are a perfect 4/4, both predicting the "minor upset" of Florida Gulf Coast by NJIT. I do not expect this perfection to last across all conference tournaments.
Projections (So Far):
| Conference | EDM | SPM | Actual |
|---|---|---|---|
| Atlantic Sun | Lipscomb | Lipscomb | TBD |
| Big South | Radford | Radford | TBD |