The Descending Triangle: A Bearish Chart Pattern by Aksel Kibar, a Guest Analyst on BitcoinLive

SUMMARY
On BitcoinLive; daily Crypto updates are made available while also, on demand analysis requests are fast filled. Join us as we have now opened up monthly and quarterly subscriptions. Use this link: https://bitcoin.live?aid=110. Below is a guest post by a well know Chartis, Aksel Kibar
The Descending Triangle: A Bearish Chart Pattern by Aksel Kibar, a Guest Analyst post on BitcoinLive.
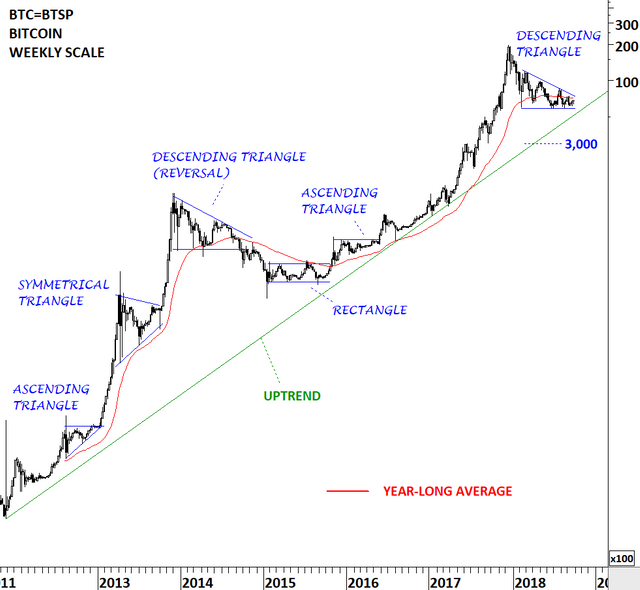
Descending triangle is a bearish chart pattern. It can act as a continuation as well as a reversal. A downward sloping trend line formed due to sellers being impatient at every rally high and selling at a much lower levels compared previous highs gives the chart pattern its bearish bias. Buyers try to defend the price at the same price level which shows itself as the the horizontal boundary of the descending triangle. Successful breakouts usually breach the lower boundary of the chart pattern resulting in a decline. However, it is not uncommon to see a breach of the upper boundary resulting in a failed descending triangle chart pattern completion. One should be open to both possibilities.
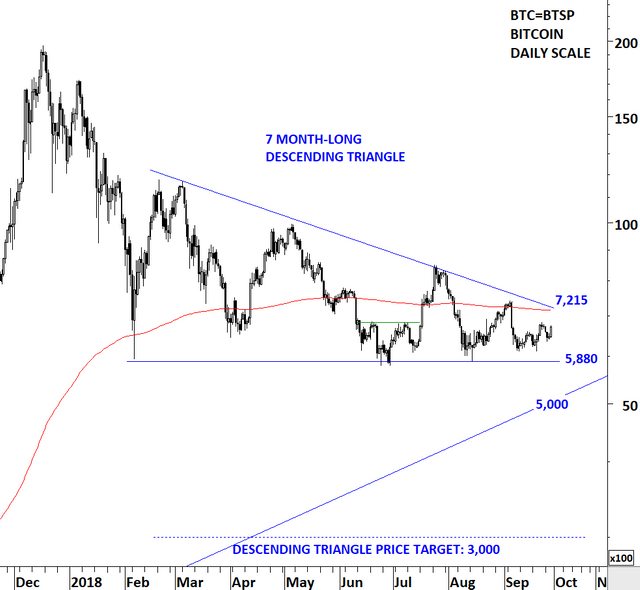
Current price action and the chart pattern development suggests a possible bearish descending triangle forming with the horizontal boundary acting as strong support at 5,880 levels. The downward sloping upper boundary is acting as resistance at 7,220 levels. Volatility is at an extreme low level. A decisive breakout from the 7 month-long descending triangle is likely to result in a strong directional movement. Breakdown of the 7 month-long descending triangle can send the prices as low as 3,000 levels. Breakout above 7,220 levels will put the bearish interpretation in question and suggest higher levels.
Below is an educational video explaining in detail how a descending triangle develops, how you can calculate possible chart pattern price targets and the possible price action following the breakout.
Legal Disclaimer: I am not a financial advisor nor is any content in this article presented as financial advice. The information provided in this blog post and any other posts that I make and any accompanying material is for informational purposes only. It should not be considered financial or investment advice of any kind. One should consult with a financial or investment professional to determine what may be best for your individual needs. Plain English: This is only my opinion, make of it what you wish. What does this mean? It means it's not advice nor recommendation to either buy or sell anything! It's only meant for use as informative or entertainment purposes.
Triangles or not, all things shall pass and time has no hold on my love for Crypto...to the moon!
That kind of attitude shall sustain your long term greed for quite a while!
Interesting but I don't think bitcoin can break below 6k. The 6k support line has been pretty bouncy. Lets hope for a break above 7.2k as you said.
I’m projecting that it does but it could be brief in that price comes right back up. This would be equivalent to a bull wick.