Time Warner (TWR): What Happens After an Impulse?

SUMMARY
Note: For anyone who missed the BitcoinLive Information Webinar, here is the replay link: https://www.youtube.com/watch?v=32l40SNYOp4
As of June 4th, ALL Crypto Analysis will be posted on the BitcoinLive channel and Steemit will be dedicated for Equity, Commodity and Options Analysis. To Signup for the BitcoinLive limited Founding Membership slots, use this link: https://get.bitcoin.live/haejin/
__
Based on this weekly chart of Time Warner (TWR), its price might need a bit of rest. After a near vertical ascent through five waves (blue); a classic ABC flat correction was executed. Since the red C wave bottom, TWR price impulsed once again and based on the Elliott Wave count, the five impulse sequence coudl be complete.
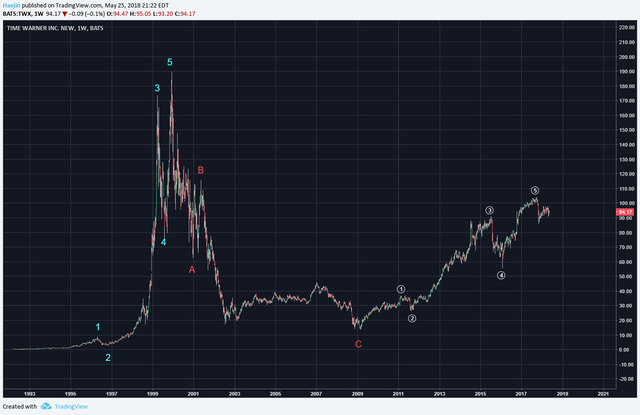
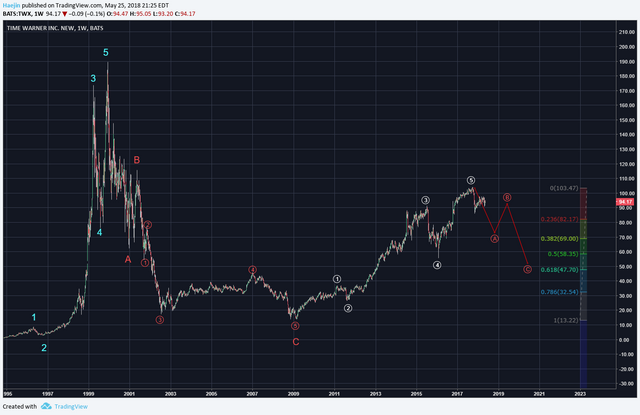
The subwaves qualify the higher degree of trend waves. Since Elliott Waves states that after five waves, there is a requisite three wave retracement. This potential is shown as a red ABC wave sequence. The C wave should retrace to the 0.618 Fib level.
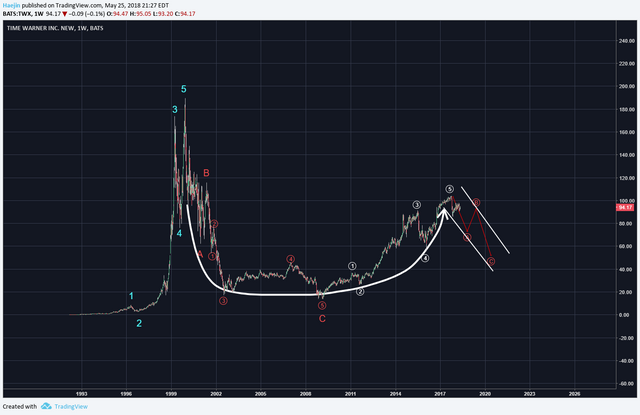
From a pattern perspective, the Cup & Handle seems to well fit. The ABC correction would coincide with the handle formation. I believe there is a broader market correction that might be approaching.
Legal Disclaimer: I am not a financial advisor nor is any content in this article presented as financial advice. The information provided in this blog post and any other posts that I make and any accompanying material is for informational purposes only. It should not be considered financial or investment advice of any kind. One should consult with a financial or investment professional to determine what may be best for your individual needs. Plain English: This is only my opinion, make of it what you wish. What does this mean? It means it's not advice nor recommendation to either buy or sell anything! It's only meant for use as informative or entertainment purposes.
Please consider reviewing these Tutorials on:
Elliott Wave Counting Tutorial #1
Elliott Wave Counting Tutorial #2
Elliott Wave Counting Tutorial #3
Laddering and Buy/Sell Setups.
Laddering Example with EOS
Tutorial on the use of Fibonacci & Elliott Waves
@haejin's Trading Nuggets
Essay: Is Technical Analysis a Quantum Event?
Follow me on Twitter for Real Time Alerts!!
Follow me on StockTwits for UpDates!!
--
--


I have so much respect for this man.Wonderfully demonstrated, thank you for this. Its quite helpful.
@haejin, could you please look at the Salt again? It corrected more than 0.886 already, and continues to go lower. Something doesnt feel right.
It looks like wedge to me.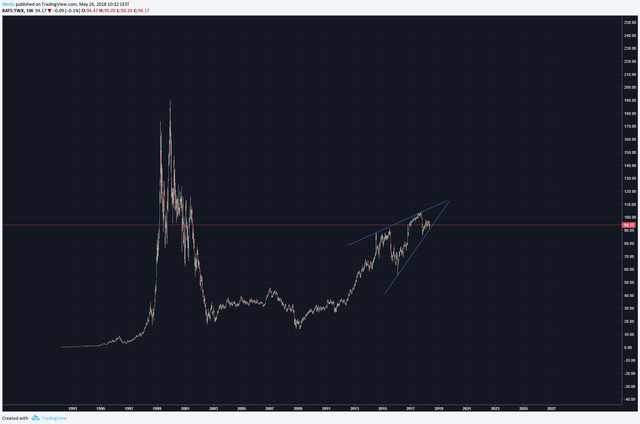
So one more push up before correction in this case.