Why I am bearish on the US Dollar

Is the nine year bull market in the US Dollar over?
Below is the long term chart the dollar index, an index comparing the rate of the USD against a basket of major currencies. Like many markets, this is very cyclical, and we can see a six year up trend, followed by an eight year down trend, followed by a nine/ten year up trend, followed by a seven year down trend and now an eight/nine year up trend until the end of last year/start of this year. The length of the current trend implies that we may be nearing, or at the end of this bull market.
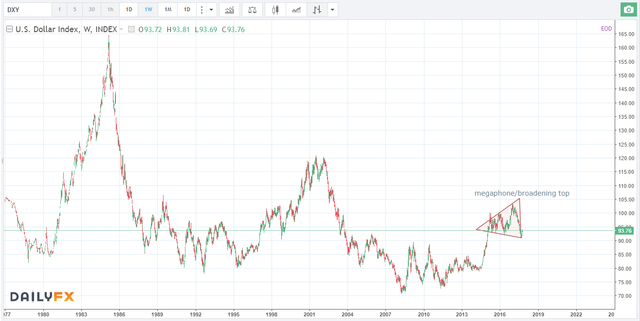
Note also that the peaks of each bull market have been lower each time. This shows a weakening of the dollar dominance in the world, and there are many signs in the news that the world may be moving away from its historical levels of reliance on the dollar.
Below I have zoomed in on the recent potential topping pattern on a weekly chart:
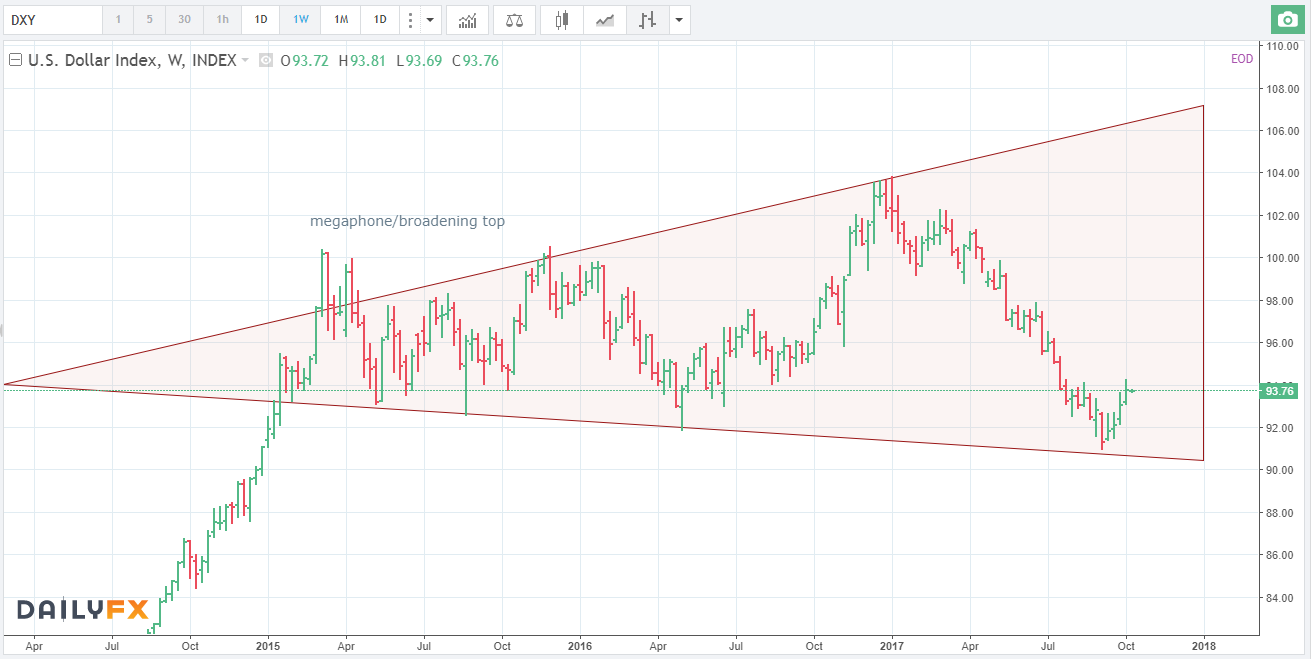
This pattern is called a megaphone or broadening top pattern. Where higher highs and lower lows are simultaneously being set. As I have mentioned before, the bigger the pattern, the more significant, as at higher timescales, the prices represent signal more than noise, which dominates lower timescales. Obviously, the name implies that it represents the top of a market. As we mentioned previously, the bull market in the dollar has lasted for a long enough time that we can consider this to be a possibility.
From January, prices fell from the top of this pattern right down to the bottom, before recently showing some support. However, you should notice that prices have normally turned back before the recent low, with only lone bars dropping down to touch the support line. In fact, let’s look at the same chart from a different perspective:
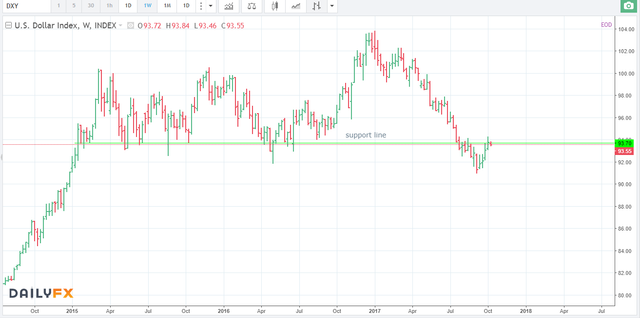
There has been a line of support at current levels. Until the most recent break, prices have turned immediately back upwards if they have ever been able to close below this line, mostly they have not been able to close below it. So another way to look at it (and we should always look to view the charts in a different way, including in a bullish way if we are bearish), is that prices broke support in July and August and have now retraced to retest the support line. Therefore, if prices fail at this level, we could see a strong continuation in the downtrend.
Below is the daily chart from yesterday:
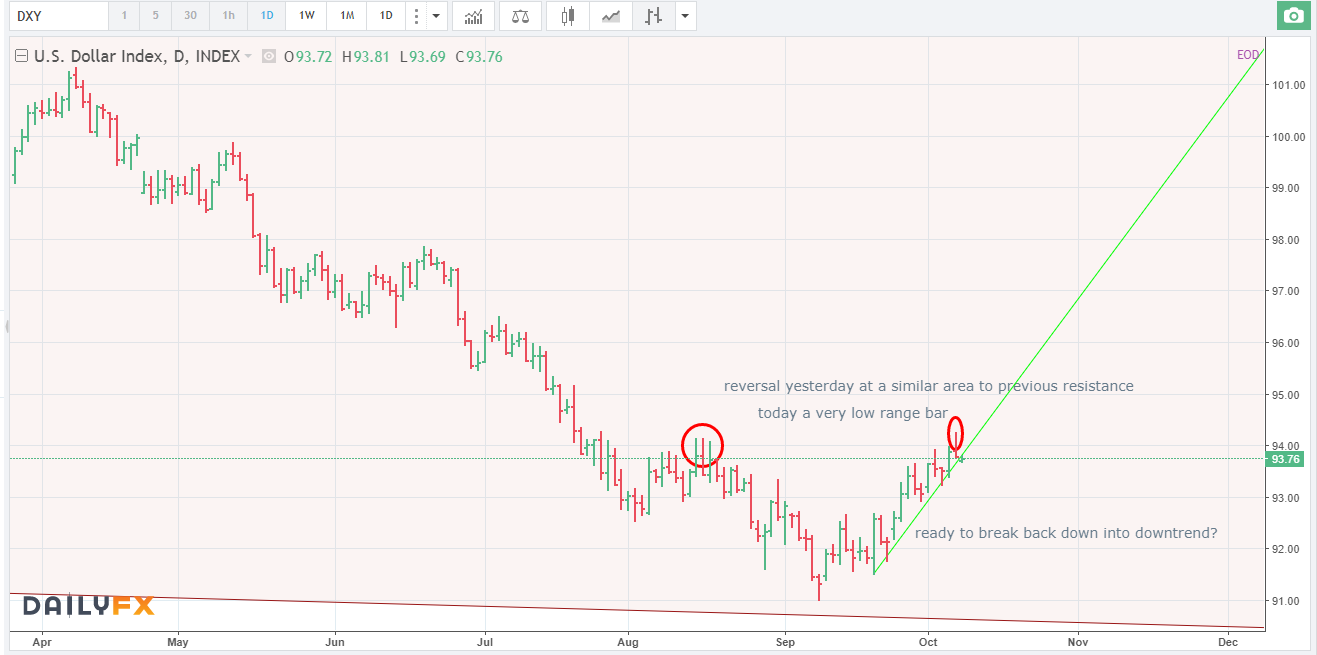
Prices reversed strongly at an area of similar recent resistance (as well as being around the long term support line) and then on Monday formed a small range bar. These small range bars often occur before breakouts, and may be an indication of a break of the recent uptrend support line.
These were in my thoughts in the past couple of days where I got short the USD against multiple other currencies and precious metals.
Today, we have seen a drop in the dollar, but it is too early to tell if this will be a continuation of the fresh bear market or not. However, we are well placed to profit if it is! And if not, will get out for small losses to await the next big opportunity 😉