Becoming a Profitable Trader With Technical Analysis PART THREE - Indicators
Hello Steemians!
Today I am going to continue with part three of my 'Becoming a Profitable Trader with Technical Analysis' series and I am going to talk about all the different indicators you can use when analyzing a chart. This can be one of the most confusing parts of technical analysis because it makes the chart look so much more confusing than needs to but the key is to use them in moderation and use them correctly. I will continue following the outline set out in earlier posts:
Becoming a Profitable Trader With Technical Analysis
Part One: Philosophy and Risk
Part Two: Charts and Patterns
Part Three: Indicators
Part Four: Strategies for Short Term and Long Term
Part Five: Analyzing Popular Steemian's Techniques
Indicators - Which Ones To Use?
There are literally hundreds of indicators in any platform and thousands more being developed every day by independent developers and they are divided into two categories:
- Leading Indicators - These indicators aim to predict what will happen next in the market such as momentum and RSI(will cover these later). The goal of most leading indicators is to tell you one thing, if the market is overbought or oversold and indicate a reversal.
- Lagging Indicators - These indicators aim to confirm trends and generally follow the price movement, an example would be moving average. The goal of these is to confirm a trend or to give you an idea if the trend is starting to go sideways or even reverse.
One key thing to remember about indicators is:
They are not always right! They are used to confirm a trend or to identify a trend but they should not be used alone, they need to be used along side other forms of confirmation. Please tread carefully.
So with that being said, let's get into some of the indicators I use regularly:
Indicators to Use
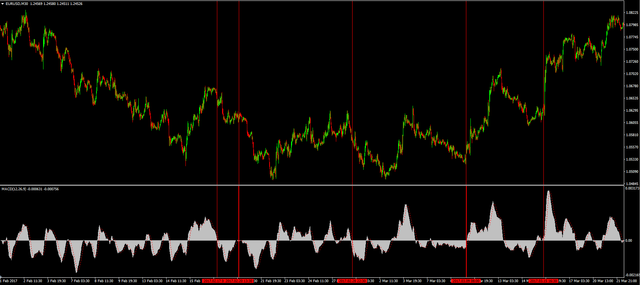
Moving Average Convergence/Divergence (MACD)
This is one of the most popular indicators although not everyone who uses it know quite how it works other than it lets you know when the trend is changing. A moving average is an average of a particular set of data points from the past and is plotted with a slow or fast moving line depending on the precision you give input when you apply it. How the MACD works is by using two moving averages usually one with low precision and the other with a higher precision that are plotted over a center line. It is the difference between these lines that cause the movement and when they cross each other on the line they are equal. This is pretty confusing so take a look at this chart and it should clear it up a bit.
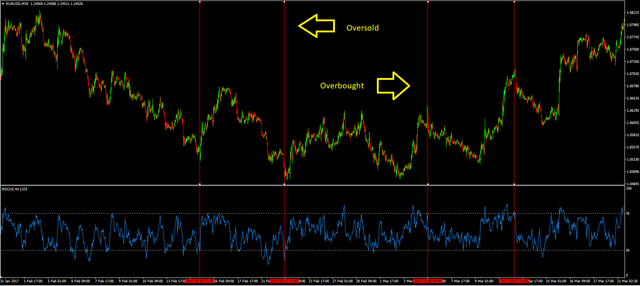
RSI - Relative Strength Index
This is another one that people use quite often and I have a strategy based around this one that I will write about tomorrow. The math behind the RSI is a bit too complex to go into but in short it uses the average of days with up market closes and average of days with down market closes to come up with a moving line that can tell you if the asset is overbought or oversold. The standard setting is a 14 day calculation and a high of 70 and a low of 30, when the line crosses 70 it means the asset is overbought and will correct down and when it crosses 30 it means it is oversold and will correct up.
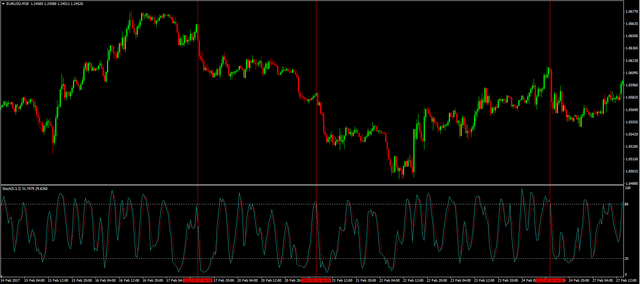
Stochastic Oscillator
This is another very popular one that works in a very similar way to RSI, it indicates overbought and oversold conditions. This one is based on momentum and is represented by two lines, one is the momentum and the other is the moving average of the momentum. This oscillator indicates that when the lines cross 80 the asset is overbought and will reverse down and when it crosses 20 it is oversold and will reverse up.
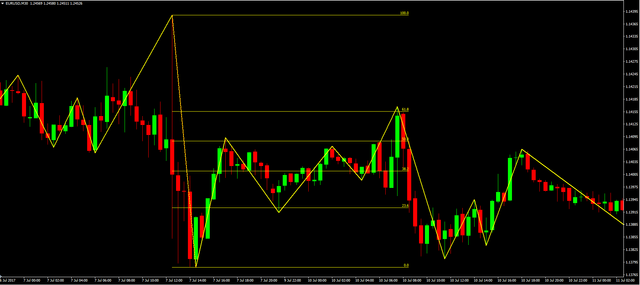
Zig Zags and Fibonacci Retracement
So the fibonacci tool is not necessarily an indicator but it is a very useful tool anyway and when you pair it with zig zags it can be very useful. Zig zags is exactly like it sounds, it puts a zig zag pattern across the chart going from high to low and you can set the precision to make it tighter bunch or more spread out.
The fibonacci tool works when drawn between a high and low prices on a chart and dividing the distance by the fibonacci ratios and will indicate potential support and resistance points along for the future. It is based on the famed fibonacci sequence where every number is the sum of the last 2 numbers.
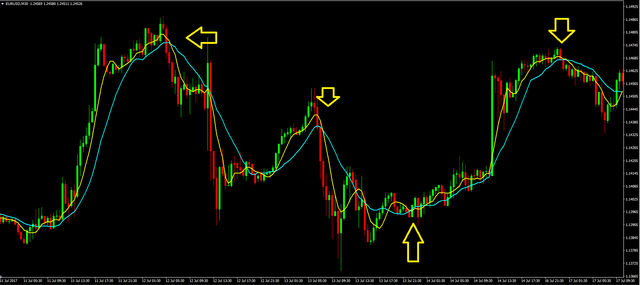
Moving Average Crosses
I said earlier that the moving average is a lagging indicator that follows the market and indicates a change in trend but does not predict the future. One popular technique with this indicator is to apply it twice to a chart and set the precision on one low(this chart is 6, yellow) and the other set high(on this chart 14, blue) and watch for the more precise line to cross the less precise. This method can be extremely profitable and can give you a real edge. I have a strategy I will share tomorrow that can be immensely useful for making profits that follows this idea.
What's Next?
Now that I have outlined some of the best indicators you should go and practice using them on real charts and see how you fare in real world scenarios. My biggest advice is:
Do not clutter your chart with lots of indicators because it is very easy to get overwhelmed and start seeing false positives everywhere. Use chart patterns and indicators to confirm one another and keep your focus on the trend and not what indicators are trendy.
Tomorrow I will focus on a few strategies that have worked well for me that can give you continued success in your trading career. I hope you enjoyed this article and thanks for reading!