Nebulas (NAS) Correction Could be Nearly Complete Given Proximity to the Apex Making it an Attractive Ladder Cast Entry

SUMMARY
Nebulas (NAS/USD) chart is difficult to ascertain as it is not available in Tradingview or Coinigy. The below chart was capture from Bitscreener and analyzed using Powerpoint for labels. Still, the chart looks beautifully bullish. Why? I've always maintained that the most ideal time to buy is at the terminal ends of a correction. This a,b,c,d,e waves fit very well into the triangle pattern. Given the proximity of the price to the Apex, the point at which the triangle lines intersect, the odds are that price will break to the upside.

While Powerpoint doesn't have Fib charts or EW prelabels; I've done best possible to physically place the Elliott Waves along an ascending arrow. The condition of this move is the the bottom support of the triangle must hold. There might be a brief piercing of it for bull wick effects, but it must not be breached decisively.
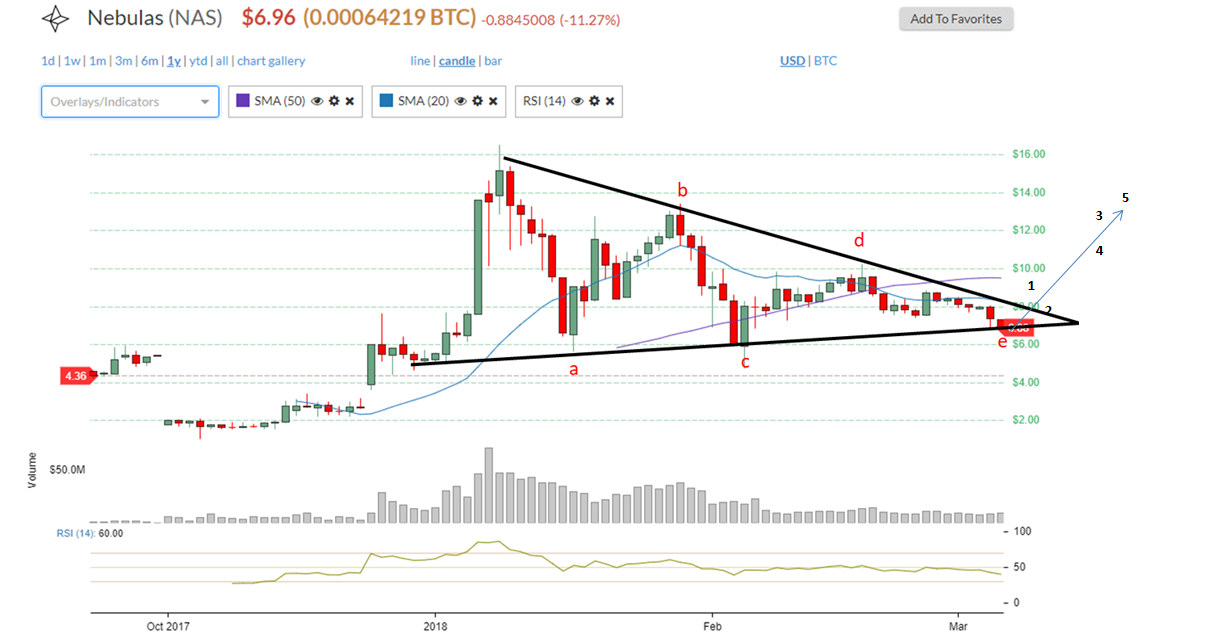
Here is a closeup of the chart. It can be labeld as a WXYXZ and the final Z is sublabeled as red a,b,c. There is good probability that the correction could be almost done; even with a bit lower low prices. Attractive ladder cast entry.

Legal Disclaimer: I am not a financial advisor nor is any content in this article presented as financial advice. The information provided in this blog post and any other posts that I make and any accompanying material is for informational purposes only. It should not be considered financial or investment advice of any kind. One should consult with a financial or investment professional to determine what may be best for your individual needs. Plain English: This is only my opinion, make of it what you wish. What does this mean? It means it's not advice nor recommendation to either buy or sell anything! It's only meant for use as informative or entertainment purposes.
Please consider reviewing these Tutorials on:
Elliott Wave Counting Tutorial #1
Elliott Wave Counting Tutorial #2
Elliott Wave Counting Tutorial #3
Laddering and Buy/Sell Setups.
Laddering Example with EOS
Tutorial on the use of Fibonacci & Elliott Waves
@haejin's Trading Nuggets
Essay: Is Technical Analysis a Quantum Event?
Follow me on Twitter for Real Time Alerts!!
Follow me on StockTwits for UpDates!!
--
--


Please do $VEE, Haejin. Also you could use coinmarketcap chart for added history.
Let us all hope for the best and earn huge profits
Good evening friends, I know that you are someone very busy and despite all the controversy that you do not harm the community and the use of your vote is your problem. But I'm insisting that I need a little help to start a project that is based on giving an opportunity to all those publications that are being undervalued with a small contribution as a (Upvote, reSteem or any type of donation would be helping this project to be consolidate) if you want to know more visit my post and you can find more information in my last post. I know that you.
You can use trading view on nebulas on huobi.pro, and use fib retracements:
here: https://www.huobi.pro/nas_btc/exchange/
Thank you very much sir!!!
Looks like NAS coiling up and ready to break out.
thanks for sharing!
Nice one. Thanks for sharing @haejin ✌
- - - - - - - - - - - - - - - - - -
•Knowledge is Power.✔
•Information is liberating.✔
•Education is the premise of Progress.✔
♿Join me in this awesome series of Discovery I'm about to start on "Types of Fruit and their Benefits" 🍌🍎🍏🍊🍉🍐🍑🍒🍓🍈🍍🍇🍆🍅🌽.
💡
¶We need to know what's best for us as human beings, what we should take in, when we should and how best we should.
¶I'll be posting about different types of Fruits and their Benefits, Good and Bad, and Best Form for intake or application.
Remember,
Health is Wealth!💯
Simply follow me @emmykeys01 to get Updated.
Much love 😍😍😍😍😘
How can I ask for a coin analysis?
I'm your fan. Email?
great info....thanks for sharing