5 Trading Strategies With Accurate Candlestick Patterns

In the world of crypto stock trading, candlestick techniques need to be mastered to get maximum profit and minimize losses. The currently used candlestick comes from Japanese charting style and has been used for over 100 years. In the crypto market, there are five trading strategies with candlestick patterns have made the achievement and success of the trader.
The crypto exchange has just grown in recent years. Unlike forex, cryptocurrency has a different pattern in the market. It could have doubled the price of crypto, or even dropped much worse. Cryptocurrency trade is considered very risky, especially for beginners. How to anticipate the loss of trading crypto, then we need to master a little trading strategy with candlestick patterns.
Graphs with candlesticks reflect short-term views, sometimes lasting less than 10 trading sessions. Candlestick is a very complex and sometimes elusive system. Each candlestick represents a certain time, a popular time frame usually 1 minute and 5 minutes.
If using a 5 minute time frame, each candlestick will show high, low, open and close prices. The 5 minute period will show the direction the price moves during that time. After five minutes, a new candlestick will appear. There are several trading strategies with candlestick commonly used by traders, including as follows:
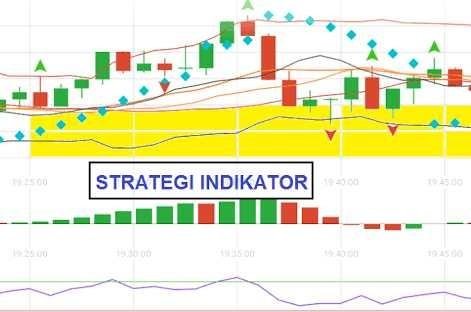
Trading Strategies With Candlestick Patterns
Each candlestick consists of a real body / wax rod and axis. The waxy body reflects the difference between the open and close prices in that period. Open and close prices are the first and last transaction prices for that time period. When there is no body or very small, it means that the open is almost the same.
The bars are colored and depend on the scheme used by the charting platform. Generally white and black, green and red. White or green candlesticks mean higher finish price during that time period. Where the closing price is above the open price. While black or red wax means the finished price is lower during that time period.
The candlestick represents the difference between the opening price and the closing time period. The axis or tail is a small thin line above and below that represents the high and low price for that period. When the axis appears above the candle, it shows a high price for that period. If there is no upper axis, then the top of the candle is the highest price. Similarly, what happens on the wick at the bottom of the candle shows the low price for that period. If there is no lower axis, then the bottom of the candle is the lowest price.
In general the chart platform can make adjustments on candlestick charts. Adjustment can be started by changing the wax color up or down to show contrast the difference between up and down motion. The trading strategy with candlestick pattern is visual. So it is necessary to pay attention to the pattern to analyze continuation or trend reversal. Even to pay attention to future trading opportunities. And most importantly, that the candlestick pattern should be used together with trend analysis.
Accurate Candlestick Patterns
There are practical ways that can be applied easily in the trading strategy with candlestick patterns. Among them are Inverted Hammer, Bullish Engulfing, Piercing Line. Morning Star, and Three White Soldiers. Here's a brief explanation of these five patterns:
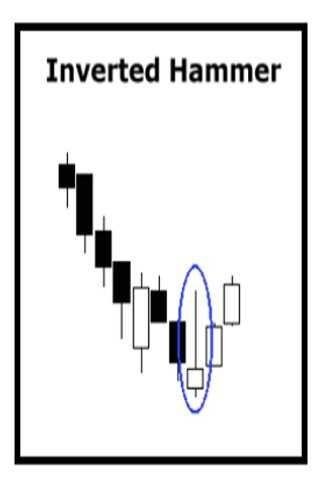
1. Inverted Hammer
The hammer is a bullish reversal pattern, indicating that a trade is approaching the lowest level in the descending trend. While Inverted Hammer is formed in downtrend and represents a trend of reversing direction or the trend is starting to rise.
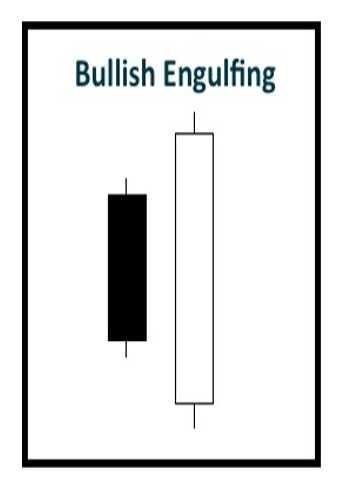
2. Bullish Engulfing
Bullish Engulfing is a reversal pattern of two candles, where the second candle swallows the original body of the first candle, regardless of the length of the axis. This pattern usually appears in downtrend and is a combination of one dark wax followed by a larger white candle.
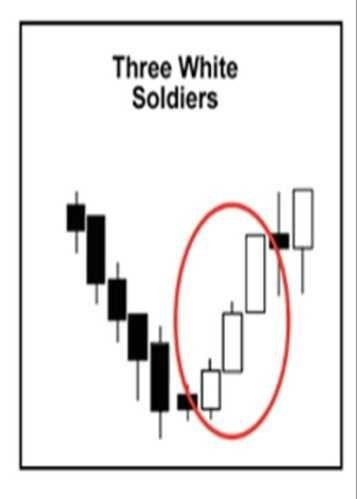
3. Three White Soldiers
Naah, this pattern is usually observed after a downtrend period. As the name suggests, Three White Soldiers consists of three long white waxes that are getting higher and continuing in the next trade. Any candlestick higher than the previous opening indicates a steady increase in purchasing pressure. But be careful, when white candles are too long to appear it will create a short sale that could cause a landslide price.
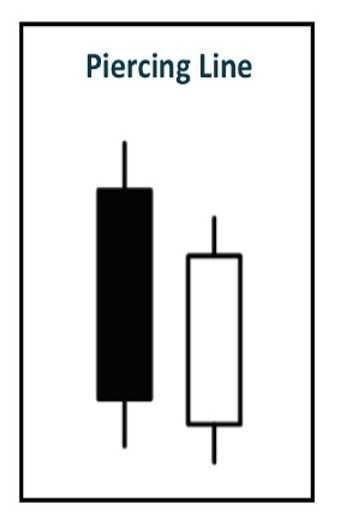
4. Piercing Line
Similar to the Engulfing pattern, Piercing Line is a reversal pattern up two candles that occur when the downtrend. The first long black candlestick is followed by a white candlestick lower than the previous closure. Usually white candles appear when buying pressure pushes the price up by half or two thirds of the black wax body.
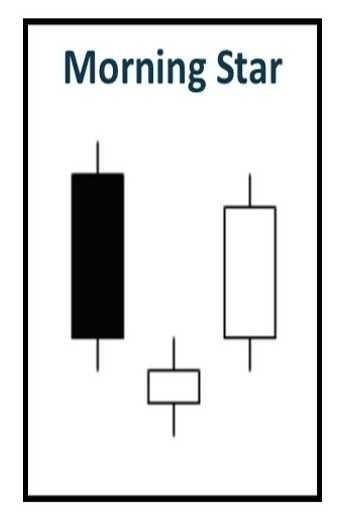
5. Morning Star
Morning starr is a new beginning that occurs when the downtrend. Notice that this pattern consists of three candles, one short short candle (doji) appearing between black candles and white candles. There is no overlap between the doji body and the previous black candlestick. These signs indicate that the previous selling pressure has subsided. And the third white candlestick shows the pressure of new buyers and the start of the Bullish reversal.
Visit & Follow my Steemit @razzi

This post has received a 14.75 % upvote from @steemdiffuser thanks to: @razzi.
Bids above 0.1 SBD may get additional upvotes from our trail members.
Get Upvotes, Join Our Trail, or Delegate Some SP