Bitcoin (BTC) Daily Price Forecast – July 9
BTC/USD Medium-term Trend: Bullish
Resistance Levels: $6,800, $6,900, $7,000
Support levels: $6,600, $6,500, $6,400
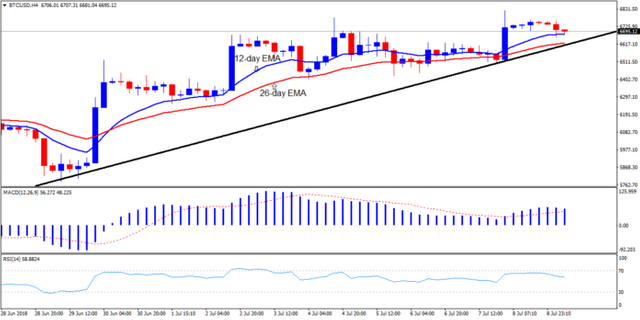
Last week, price of Bitcoin was in a bullish trend. It was trading above the $6,000 price level all through the week. In the other words, price rose from the low of $6,335.72 to the high of $6,719.30. A trend line is drawn to show the support levels of price of Bitcoin. Today, the price of Bitcoin is retracing from the recent high to the bullish trend line. If price tests the trend line and the bearish candlestick closes without breaking the trend line, traders should initiate long trades.
It is assumed that price will resume its bullish movement if price retraces from the recent high tests the trend line.Meanwhile, the MACD line and the signal line are above the zero line which indicates a buy signal. Also, the price bars of Bitcoin is above the 12-day EMA and the 26-day EMA which indicates that the bullish trend is ongoing. The relative strength index period 14 is level 58 which indicates that price is in the sideways trend zone.
BTC/USD Short-term Trend: Bullish
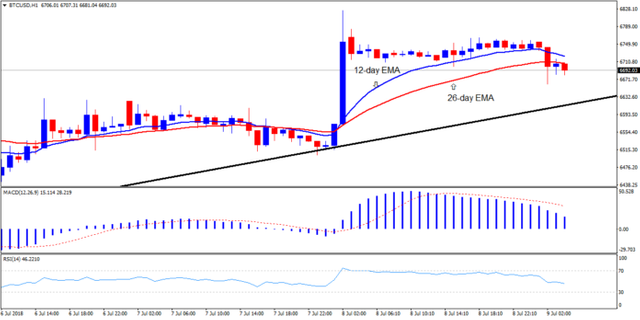
On the 1-hour chart, price of Bitcoin is in a Bullish trend. The MACD line and the signal line are above the zero line which indicates a buy signal. Also, the price bars of Bitcoin is above the 12-day EMA and the 26-day EMA which indicates that the bullish trend is ongoing.