Facebook Engagement for Advertisers Sinks 20% in 2017
Published by Buzzsumo by Steve Rayson on August 29, 2017
The average number of engagements with Facebook posts created by brands and publishers has fallen by over 20% since January 2017.
We analyzed over 880 million Facebook posts published by brands and publishers over the last year. In this sample the average number of engagements fell from 340 to 264 over the first six months of the year, as shown in the chart below.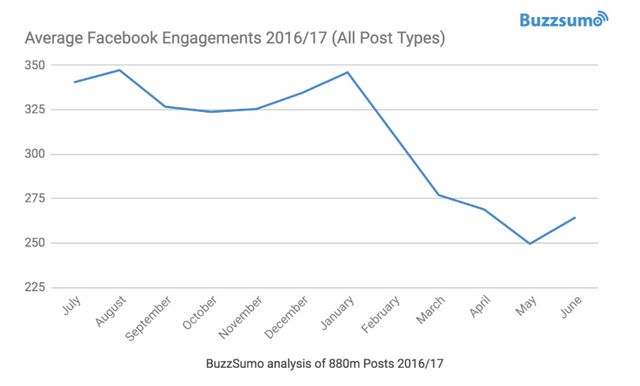
The biggest fall in engagement was with image posts and link posts. According to the data video posts had the smallest fall in engagement and videos now gain twice the level of engagement of other post formats on average. The chart below shows average engagements by post type in June 2017.
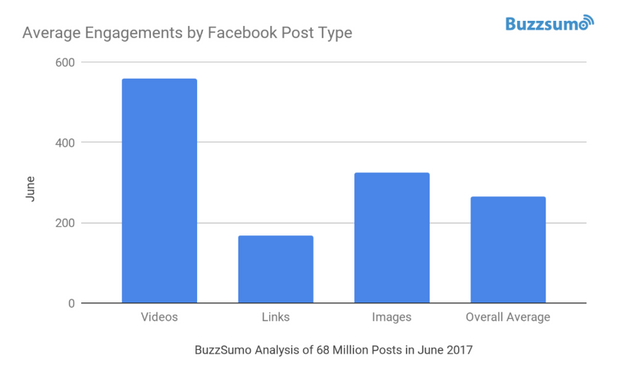
For more on video engagement read our recent research post analysing 100 million Facebook videos.
The detailed data on all 880 million posts is set out at the end of this post.
Why Is Facebook Engagement Declining?
Our survey data includes engagements for all posts, including those supported by paid promotion. There are a number of possible explanations for this declining level of engagement.
- One possible interpretation is that brands and publishers spent less on promotion over the year resulting in less exposure and engagement. However, surveys show the reverse is actually the case with brands and publishers spending more on Facebook promotion.
- A more likely explanation is that Facebook organic reach has declined significantly and increases in paid promotion have not enabled brands and publishers to maintain their levels of Facebook engagement.
- More content. Facebook say there are now on average 1,500 stories that could appear in a person’s feed. So competition is increasing and not everything can be shown.
- Facebook have also been making changes in the algorithm which decides what content to show users. Facebook say they look at thousands of factors to decide which stories to display in an attempt to show users the content that is most relevant. Facebook have also made a number of changes to the feed algorithm, for example to demote lower quality content and clickbait headlines that withhold information from the reader.
- The Financial Times reported a Socialflow survey in June 2016 showing a 42% decline in organic Facebook reach
- Marketing Land followed up this story in August 2016 reporting a 52% fall in publisher organic reach on Facebook
- In January 2017 Kurt Gessler of the Chicago Tribune reported further decreasing reach, claiming one third of their posts were not being surfaced by the latest Facebook algorithm.
- Competition in the news feed. As brands and publishers increase their spending on Facebook advertising and promotion, the more there is competition for space. AdWeek reported that Facebook’s ad revenues in the second quarter to 2017 increased 47% over the same quarter in 2016. This growth in Facebook paid ads will invariably reduce the space for other posts in the news feed.
- Further changes to the Facebook algorithm which have reduced average reach since January 2017.
- 2016 was an election year in the US. One possible reason for lower levels of engagement is that the last year’s election drove very high engagement with political posts for publishers. It may be that since the election in 2016, engagement with political posts has declined on Facebook, which has reduced the overall averages.
Our BuzzSumo Data
Facebook Posts Published by Brands and Publishers
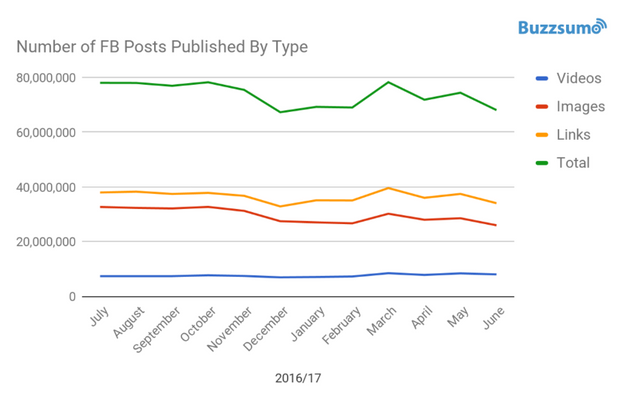
We looked at over 880 million Facebook Posts published by brand and publishers over the last year. We looked specifically at image posts, link posts and video posts. The number of posts in each month and category were as follows.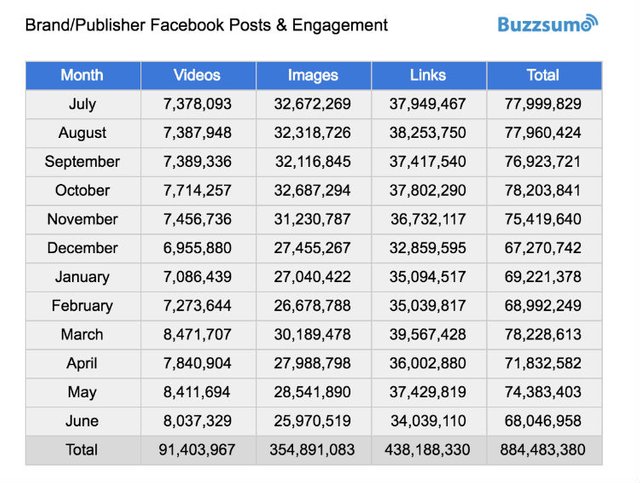
Over the year we can see a decline in the number of image and link posts published and a ten percent increase in video posts. This is to be expected given Facebook’s focus on video and the higher engagement which this format generates. However, video posts still only represented just over 10% of all posts during the year. We can see the breakdown below.
Facebook Engagement by Post Type
In January we started to see a marked decline in engagement levels which may have been due to changes in the Facebook algorithm. We are conscious Facebook algorithm changes will affect different pages and different content types in different ways. The biggest fall has been in engagements with image posts.
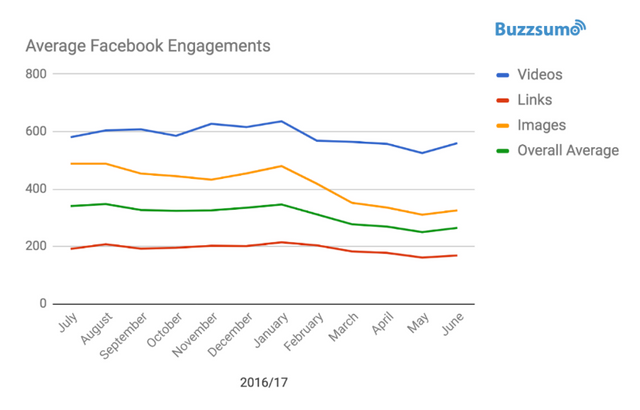
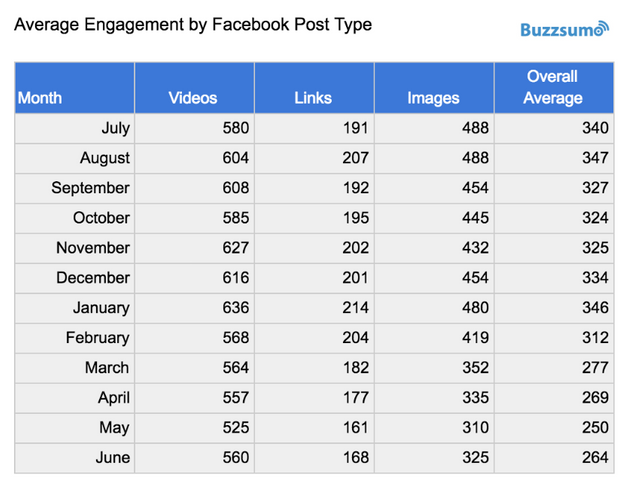 We can see that the most marked decline in average engagement was with image posts. This fell from over 480 in July and August 2016 to below 340 in April, May and June 2017. The chart below shows the trends by type.
Congratulations @thucker! You have completed some achievement on Steemit and have been rewarded with new badge(s) :
Click on any badge to view your own Board of Honor on SteemitBoard.
For more information about SteemitBoard, click here
If you no longer want to receive notifications, reply to this comment with the word
STOPCongratulations @thucker! You have received a personal award!
Click on the badge to view your Board of Honor.
Do not miss the last post from @steemitboard:
Congratulations @thucker! You received a personal award!
You can view your badges on your Steem Board and compare to others on the Steem Ranking
Do not miss the last post from @steemitboard:
Vote for @Steemitboard as a witness to get one more award and increased upvotes!