ON BALANCE VOLUME INDICATOR(OBC) and how to use it in stock market to make big profit
(Image source google. com)
Hello steemits, today i am going to explain to you one of the most important indicator which are helpful in stock market and crypto market.
INTRODUCTION:-
On Balance Volume (OBV) measures buying and selling pressure as a cumulative indicator that adds volume on up days and subtracts volume on down days. OBV was developed by Joe Granville and introduced in his 1963 book, Granville's New Key to Stock Market Profits. It was one of the first indicators to measure positive and negative volume flow. Chartists can look for divergences between OBV and price to predict price movements or use OBV to confirm price trends.
CALCULATION :-
If the closing price is above the prior close price then:
Current OBV = Previous OBV + Current Volume
If the closing price is below the prior close price then:
Current OBV = Previous OBV - Current Volume
If the closing prices equals the prior close price then:
Current OBV = Previous OBV (no change)
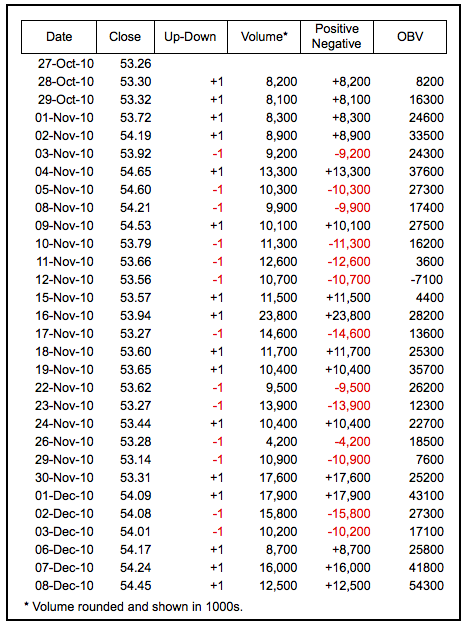
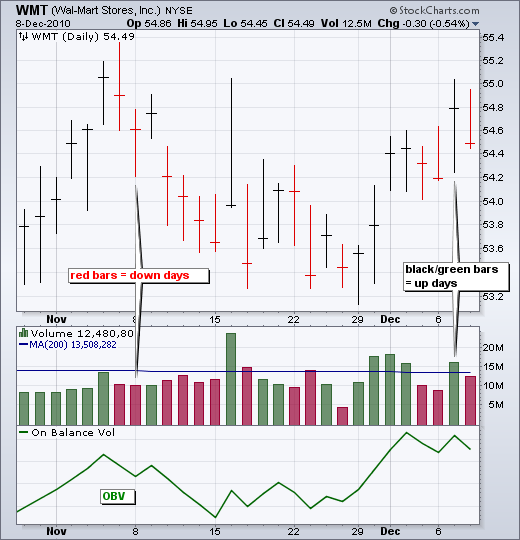
Data in the table above comes from Wal-mart (WMT). Volume figures were rounded off and are shown in 1000's. In other words, 8,200 really equals 8,200,000 or 8.2 million shares. First, we must determine if Wal-mart closed up (+1) or down (-1). This number is now used as the volume multiplier to compute positive or negative volume. The last column (OBV) forms the running total for positive/negative volume. Because OBV has to start somewhere, the first value (8200) is simply equal to the first period's positive/negative volume. The chart below shows Wal-mart with volume and OBV.
INTERPRETATION:-
Granville theorized that volume precedes price. OBV rises when volume on up days outpaces volume on down days. OBV falls when volume on down days is stronger. A rising OBV reflects positive volume pressure that can lead to higher prices. Conversely, falling OBV reflects negative volume pressure that can foreshadow lower prices. Granville noted in his research that OBV would often move before price. Expect prices to move higher if OBV is rising while prices are either flat or moving down. Expect prices to move lower if OBV is falling while prices are either flat or moving up.
The absolute value of OBV is not important. Chartists should instead focus on the characteristics of the OBV line. First, define the trend for OBV. Second, determine if the current trend matches the trend for the underlying security. Third, look for potential support or resistance levels. Once broken, the trend for OBV will change and these breaks can be used to generate signals. Also, notice that OBV is based on closing prices. Therefore, closing prices should be considered when looking for divergences or support/resistance breaks. And finally, volume spikes can sometimes throw off the indicator by causing a sharp move that will require a settling period.
DIVERGENCE:-
Bullish and bearish divergence signals can be used to anticipate a trend reversal. These signals are truly based on the theory that volume precedes prices. A bullish divergence forms when OBV moves higher or forms a higher low even as prices move lower or forge a lower low. A bearish divergence forms when OBV moves lower or forms a lower low even as prices move higher or forge a higher high. The divergence between OBV and price should alert chartists that a price reversal could be in the making.
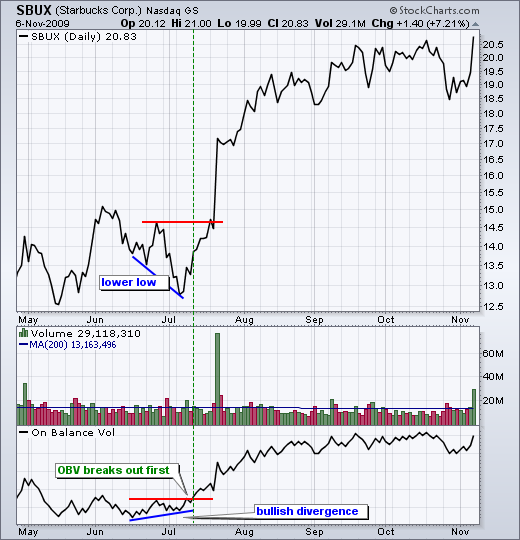
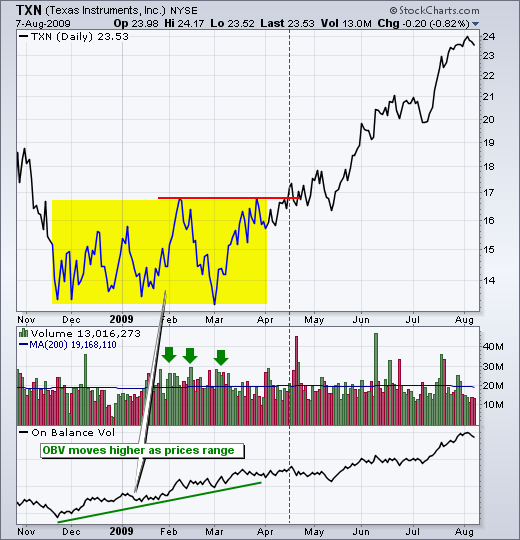
The chart for Starbucks (SBUX) shows a bullish divergence forming in July. On the price chart, SBUX moved below its June low with a lower low in early July. OBV, on the other hand, held above its June low to form a bullish divergence. OBV went on to break resistance before SBUX broke resistance. This was a classic case of volume leading price. SBUX broke resistance a week later and continued above 20 for a 30+ percent gain. The second chart shows OBV moving higher as Texas Instruments (TXN) trades within a range. Rising OBV during a trading range indicates accumulation, which is bullish.
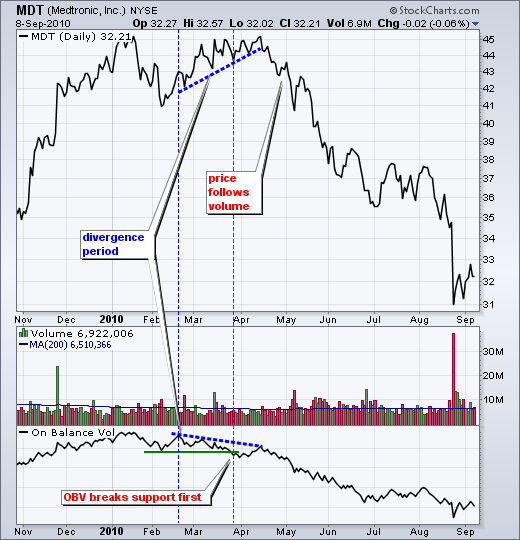
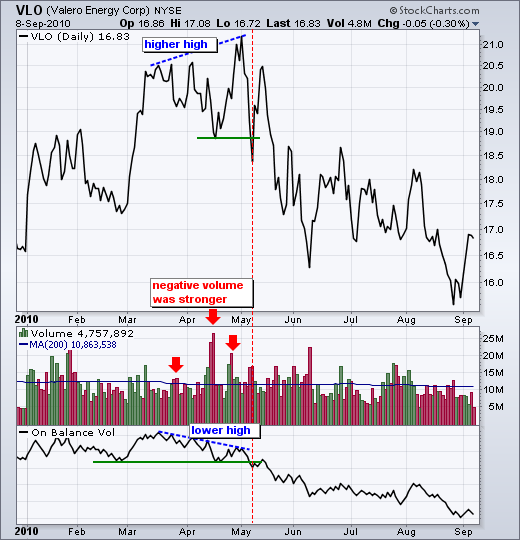
The chart for Medtronic (MDT) shows a bearish divergence with volume leading price lower. The blue dotted lines identify the divergence period. MDT moved higher (43 to 45) as OBV moved lower. Also, notice that OBV broke support during this divergence period. The uptrend in OBV reversed with the break below the February low. MDT, on the other hand, was still moving higher. Volume ultimately won the day as MDT followed volume lower with a decline into the low 30s. The second chart shows Valero Energy (VLO) with OBV forming a bearish divergence in April and a confirming support break in May.
TREND CONFIRMATION :-
OBV can be used to confirm a price trend, upside breakout or downside break. The chart for Best Buy (BBY) shows three
confirming signals as well as confirmation of the price trend. OBV and BBY moved lower in December-January, higher from March to April, lower from May to August and higher from September to October. The trends in OBV matched the trend in BBY.
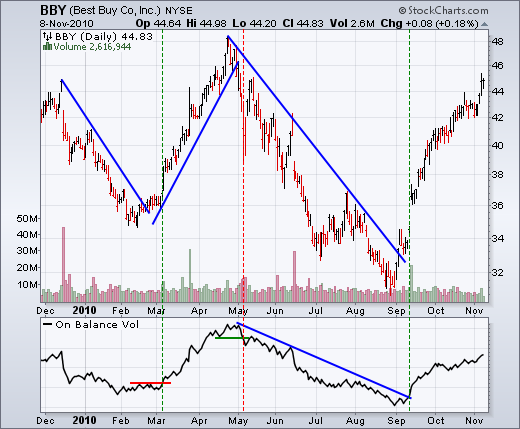
OBV also confirmed trend reversals in BBY. Notice how BBY broke its downtrend line in late February and OBV confirmed with a resistance breakout in March. BBY broke its uptrend line in late April and OBV confirmed with a support break in early May. BBY broke its downtrend line in early September and OBV confirmed with a trend line break a week later. These coincident signals indicated that positive and negative volume were in harmony with price.
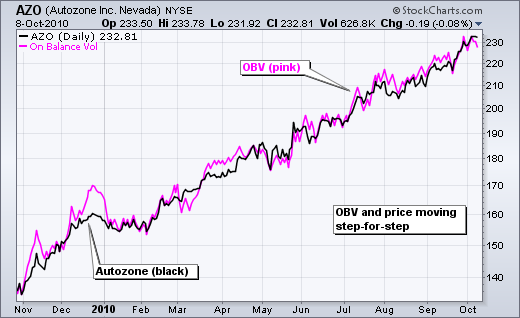
Sometimes OBV moves step-for-step with the underlying security. In this case, OBV is confirming the strength of the underlying trend, be it down or up. The chart for Autozone (AZO) shows prices as a black line and OBV as a pink line. Both moved steadily higher from November 2009 until October 2010. Positive volume remained strong throughout the advance.
CONCLUSION
On Balance Volume (OBV) is a simple indicator that uses volume and price to measure buying pressure and selling pressure. Buying pressure is evident when positive volume exceeds negative volume and the OBV line rises. Selling pressure is present when negative volume exceeds positive volume and the OBV line falls. Chartists can use OBV to confirm the underlying trend or look for divergences that may foreshadow a price change. As with all indicators, it is important to use OBV in conjunction with other aspects of technical analysis. It is not a standalone indicator. OBV can be combined with basic pattern analysis or to confirm signals from momentum oscillators.
If you are new here reading my blog be sure to read the previous post because as I said earlier. I am writing a number of them and to understand every context that I wish to teach for everyone it is important that you understand that they are interconnected, step by step.
Don't forget to follow @stockmarketinfo and resteem these posts if you like them. The content and conversations could be valuable to someone else, even if you don't know that person.
I’ll leave you for now, wishing you all the best
Wishing you all the best
Legal Disclaimer: I am not a financial advisor nor is any content in this article presented as financial advice. The information provided in this blog post and any other posts that I make and any accompanying material is for informational purposes only. It should not be considered financial or investment advice of any kind. One should consult with a financial or investment professional to determine what may be best for your individual needs. Plain English: This is only my opinion, make of it what you wish. What does this mean? It means it's not advice nor recommendation to either buy or sell anything! It's only meant for use as informative or entertainment purposes.