You are viewing a single comment's thread from:
RE: Price manipulation and zooming out logarithmic style

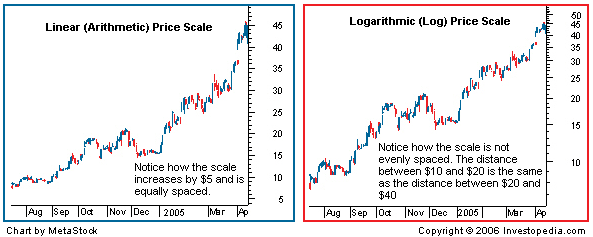
As you can see from the charts above, an increase in price from $10 to $15 is the same as an increase from $20 to $25 on the linear chart, because both scenarios represent an increase of $5. However, a logarithmic price scale will show the vertical distance between $10 and $15 to be different than the $5 distance between $20 to $25. The reason for this is that a change of $5 when the price is at $10 represents a 50% increase, while a move from $20 to $25 is a 25% increase. Since a 50% increase is more significant than 25%, chartists will use a larger distance between the prices to clearly show the magnitude of the changes.