Crypto Academy / Season 3 / Week 4 - Homework Post for Prof. @reminiscence01
Hello Everyone,
Happy new week. It is nice to be here again and am so happy to be one of the participants. The topic for this week by Prof. @reminiscence01 is "Candlestick Patterns." Is a topic that is very important to be known by all traders or investor and none of the two (Traders and Investor) can do without candlestick pattern in using technical analysis.
source
A Candlestick pattern is a simple and understandable way of displaying the price movement of a particular asset. The charts are one of the most popular technical analysis tools. It helps the traders to interpret price information without wasting much time and from just a few bars.
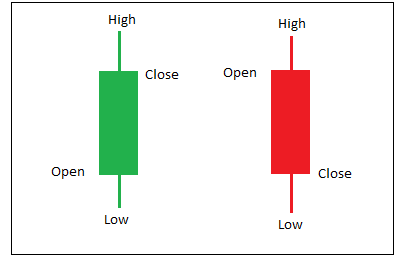
Candlestick patterns are also patterns used to predict the possible future price movement of a particular asset. Candlestick is made up of 3 basic features which is, The wick, The body, and The color.
The Body
It represents the open to close range of a bullish or bearish time frame and also the strength or control of which sellers or buyers over a market price.
The Wick
Wick in a candlestick pattern can also be called shadow. It indicates the intraday high and low
The Color
Colors in candlestick indicate or reveal the direction of market movement. A green or white body indicates a price increase, while a red or black body shows or indicates a price decrease.
There are different types of candlestick patterns in which I will be explaining some in my first answer to the first question given to me by Professor @reminiscence01.

In your own words, explain the psychology behind the formation of the following candlestick patterns.
- Bullish engulfing Candlestick pattern
- Doji Candlestick pattern
- The Hammer candlestick pattern
- The morning and evening star candlestick pattern.
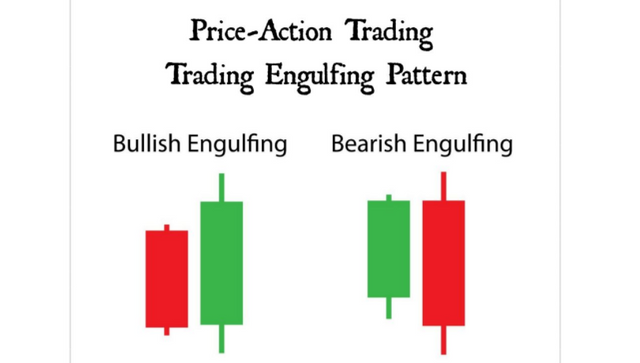
Psychology behind the formation of Bullish engulfing Candlestick.
source
The psychology behind this pattern is that, during a downtrend in price, the market keeps falling to form new lows before the bullish engulfing forms. Also, During a downtrend, the market is expected to move lower. That is, forming a red candlestick. The next candlestick which is either minute, hours, day, etc. time frame will form next to the previous candlestick closing price and it will attempt to form a new low. At this point, sudden buying pressure will occur, which will make the price close higher than the previous candlestick open forming a green candlestick. This shows that the buyers are struggling for the price from falling further. On the other hand, the bearish engulfing pattern is an opposite of a bullish engulfing pattern.
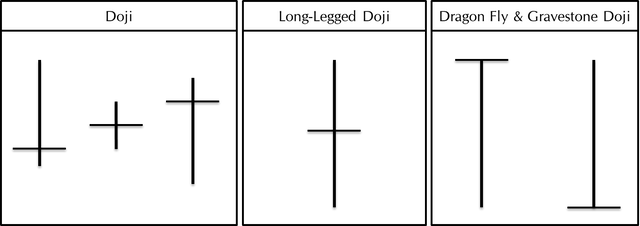
Psychology behind the formation of Doji Candlestick pattern.
.png)
source
Doji candlestick pattern shows the indecision of the traders in the market. That is, the buyers nor the sellers does not have control over their price. It shows that the price is open and closed at the same price.
The psychology behind Dojis is that in the Formation of Dragon Doji during a downtrend in price, the market keeps falling to form new lows before the forming Dragon Doji, once the Dragonfly Doji forms, it shows that sellers are restricting the buyer from taking control of the market. If it now occurs at the downtrend of the previous candlestick, it shows that the bullish reversal is about to occur.
In the formation of Gravestone Doji, Gravestone Doji is like an opposite pattern to Dragonfly Doji. It forms after a previous uptrend pattern. It is a bearish reversal candlestick especially when it forms in an uptrend of the previous candlestick timeframe.
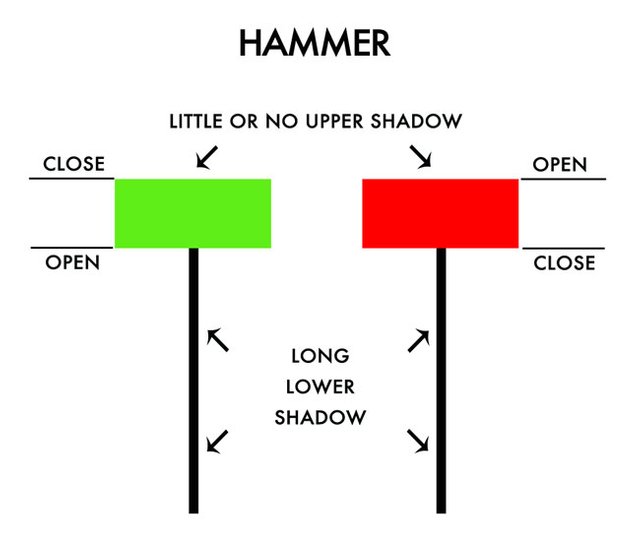
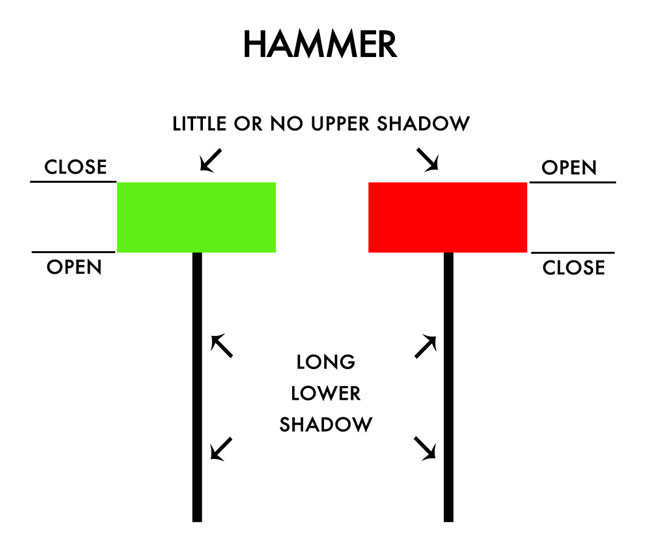
Psychology behind the formation of Hammer candlestick pattern.
source
There are two different hammer candlestick patterns formation. Which can either be, a bullish and a bearish candlestick pattern.
The psychology behind the formation of the candlestick pattern is that, where there as being a downtrend pattern in the market forming new lows before the formation of a bullish hammer, once the bullish hammer is formed, it gives a strong signal if it occurs in a trending market especially, at a support level.
source
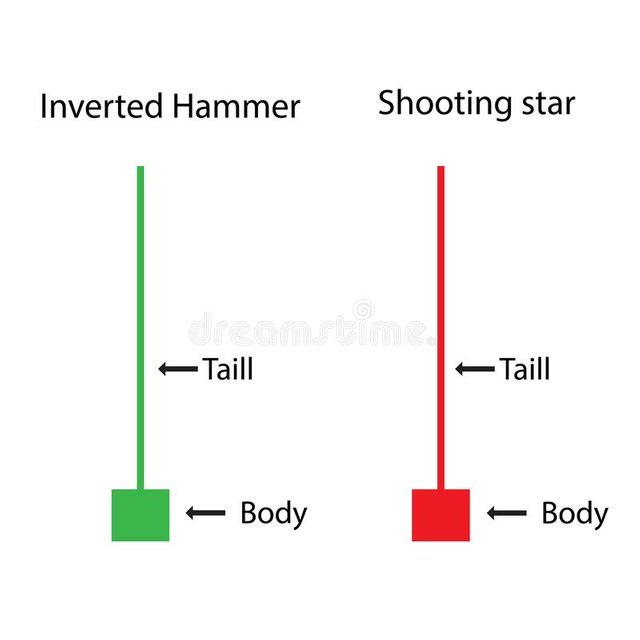
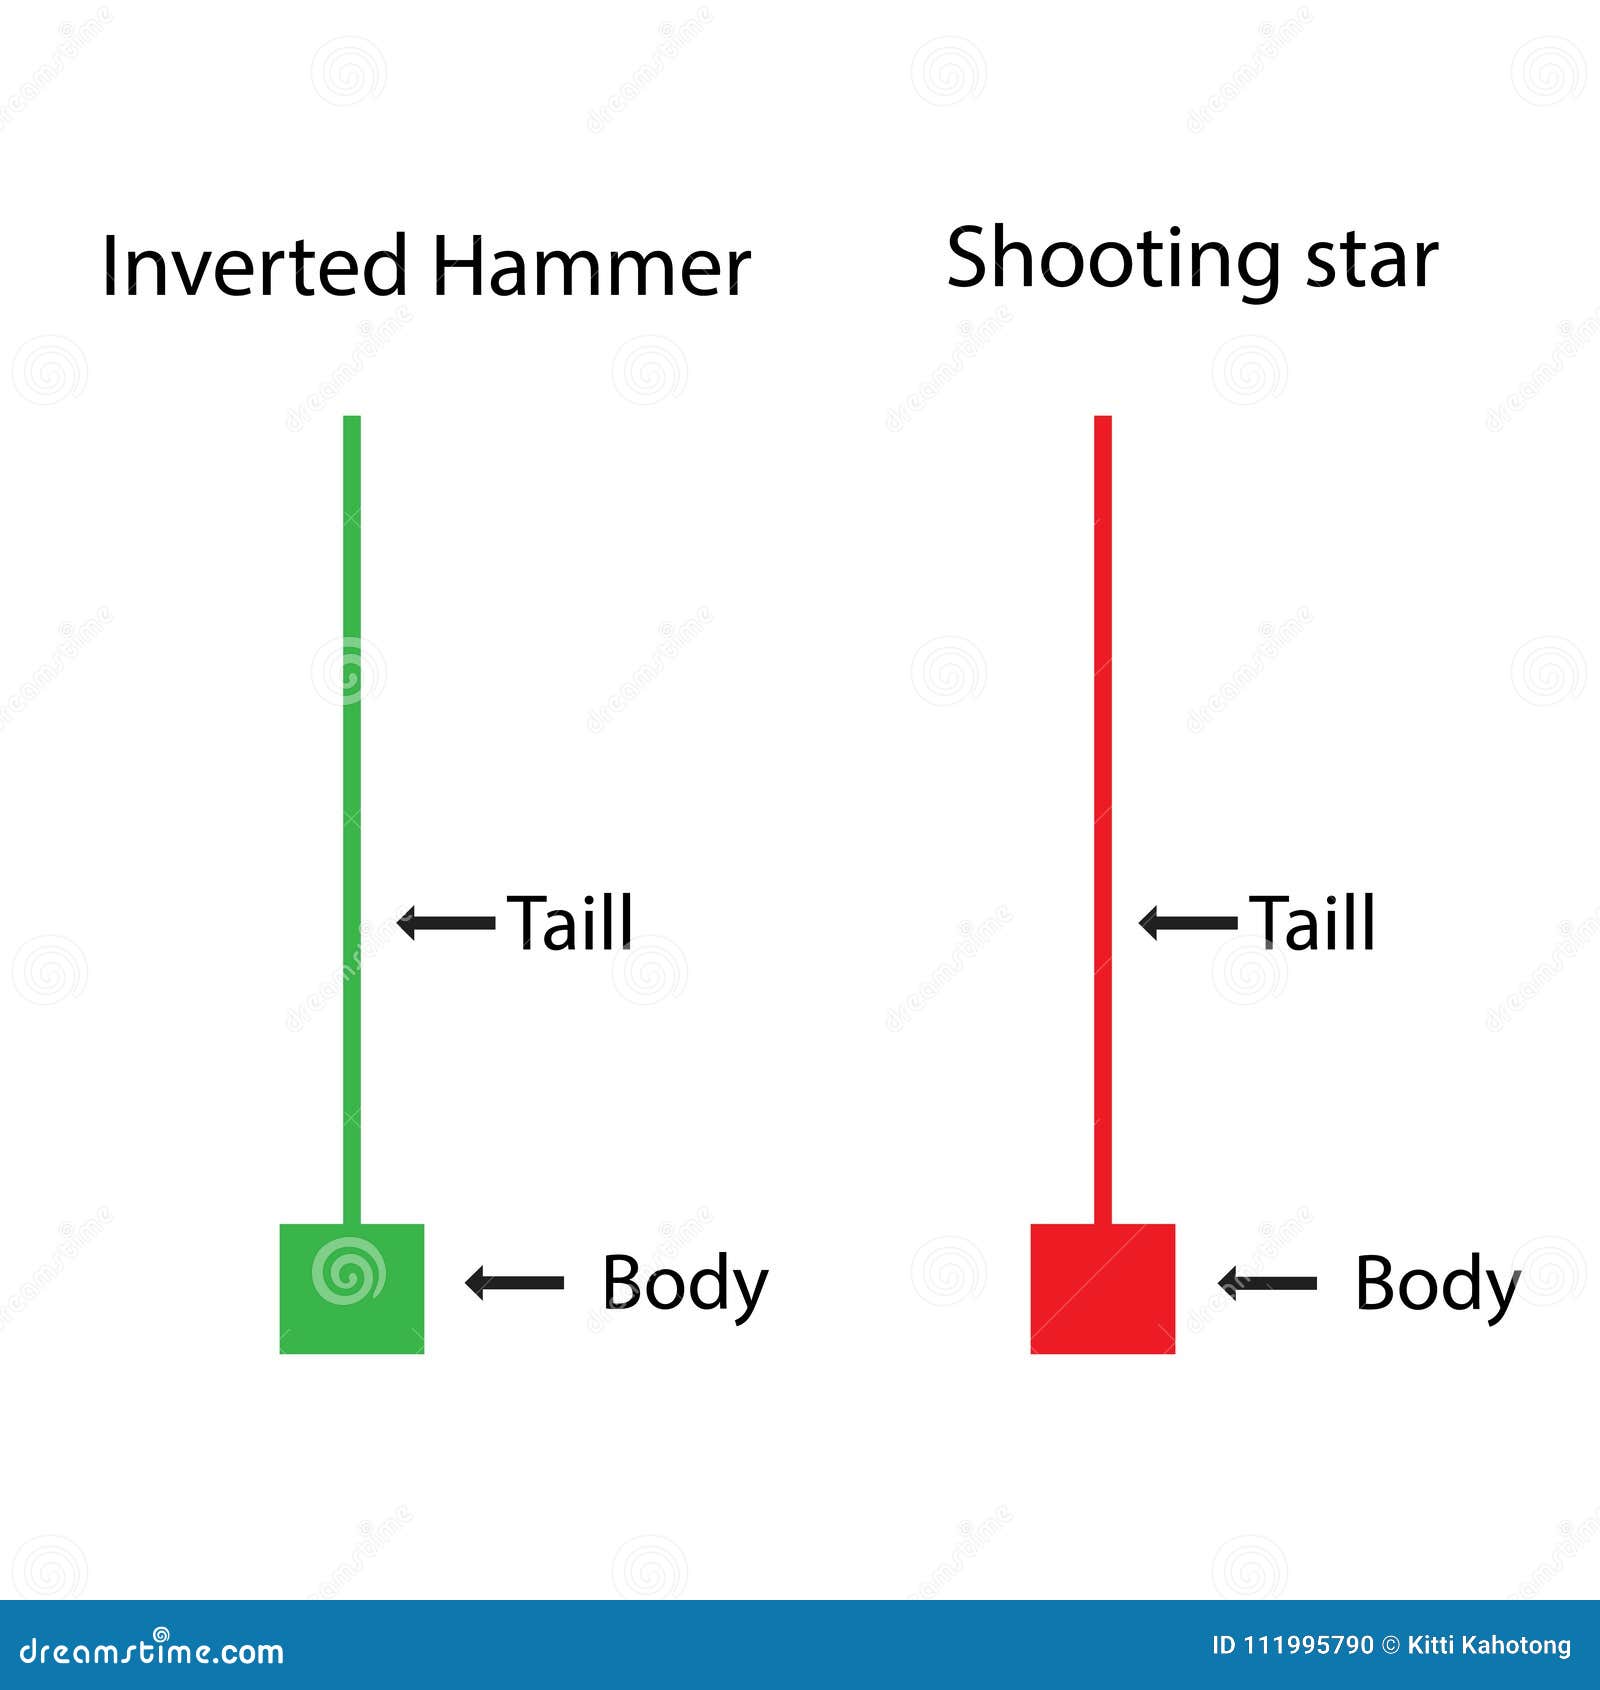
While the psychology behind the formation of the bearish hammer which is also known as the inverted hammer is that, after when there as being an uptrend in the market before the forming of the bearish hammer but after when the bearish hammer is formed, it gives a strong signal of reversal, especially, if it appears at a resistance level.
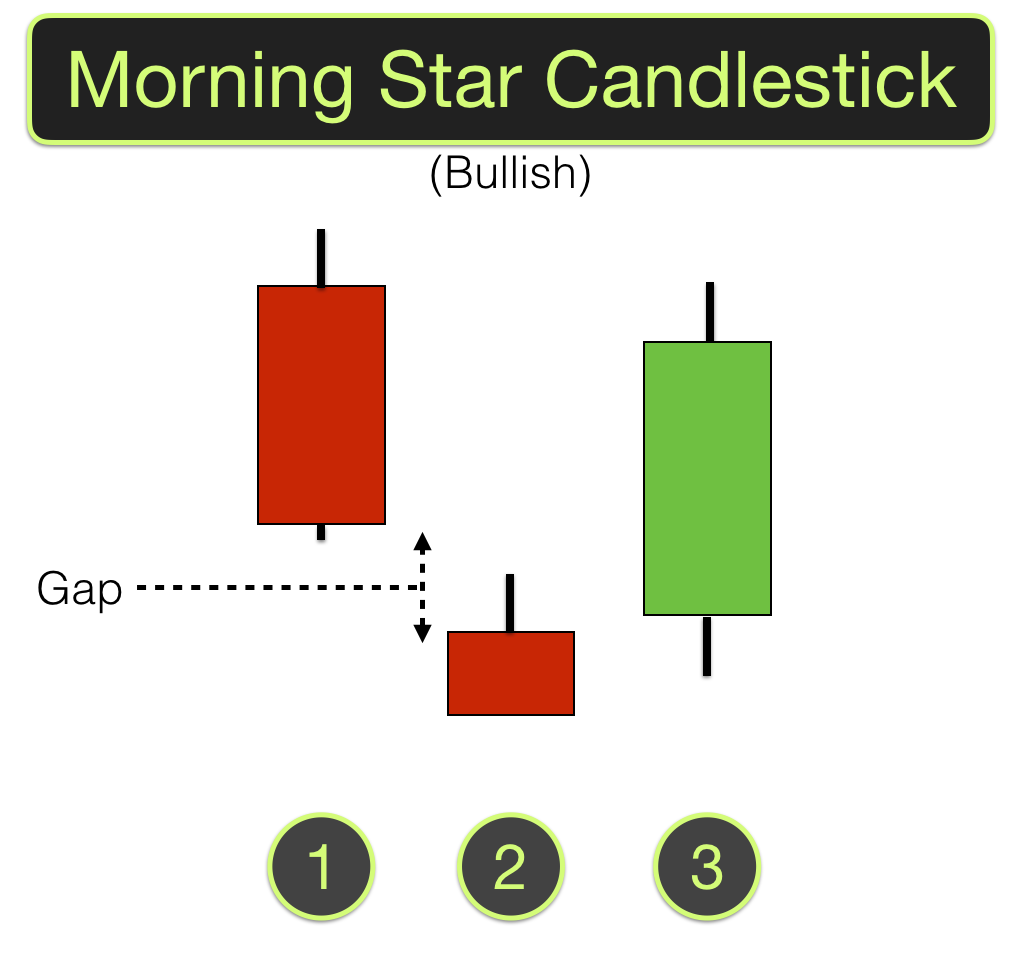
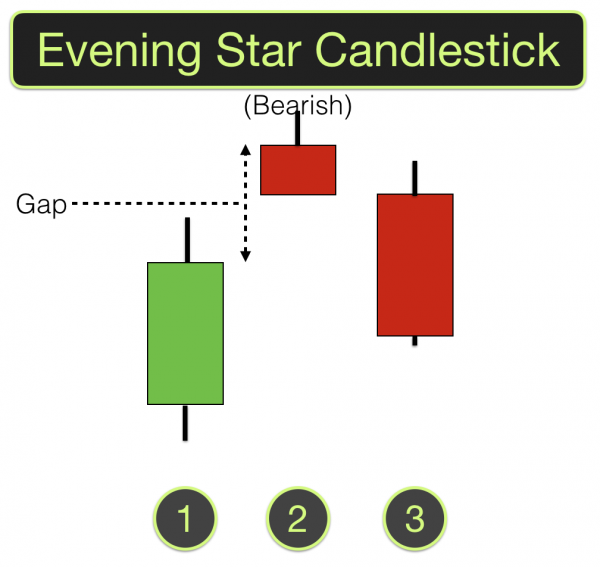
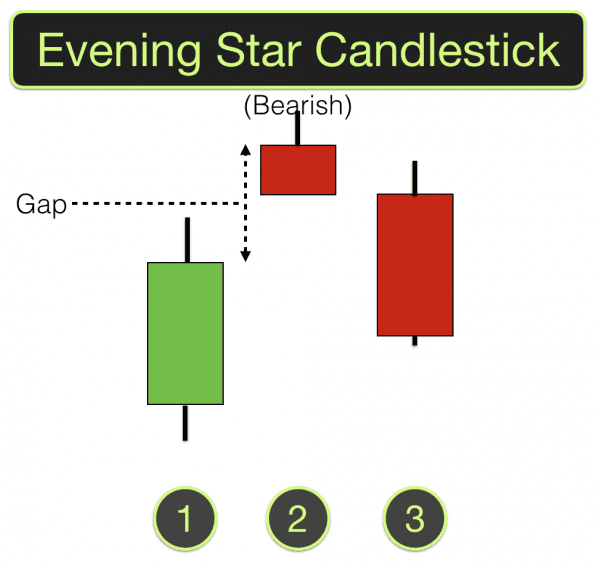
Psychology behind the formation of the morning and evening star candlestick pattern.
.png)
source
Here in morning star candlestick, the psychology behind the formation of the candlestick pattern is that the seller was in control of the market price before the buyer took control of the price. The formation of morning star candlestick in a downtrend signifies a strong uptrend (bullish) reversal if it is formed at the support level.
source
The psychology behind this one is that, is an opposite candle pattern of morning star candlestick pattern. In the formation of the evening star candlestick pattern, the buyers were in control before the seller took charge of the market price. And in the formation of the evening star candlestick pattern in an uptrend signifies a strong downtrend (bearish) reversal pattern. Especially when formed at a resistance point.
I will be explaining below the candlestick patterns listed in question one(1) on a cryptocurrency pair chart and the price reaction formation.
Bullish engulfing Candlestick pattern
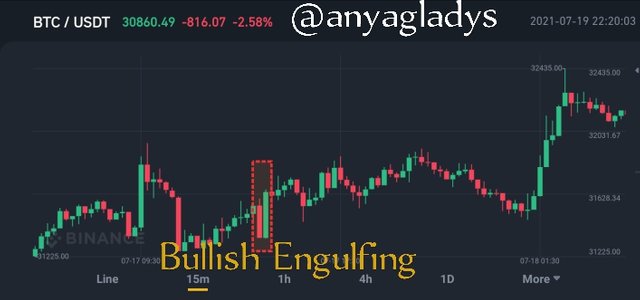
Binance
In the above chart, we can see how reversal occurs in the price movement after the formation of bullish engulfing candles. The seller was first in control of the price before the buyer came into the picture. That is, anytime a bullish candlestick occurs, it clearly shows that the buyer has taken control of the market price. Furthermore, the bullish engulfing candle has a close above the open of the previous candlestick.
On the other hand, the bearish engulfing candlestick pattern occurs in a downtrend. And when this happens, it clearly shows that the seller has taken control of the price as we can see in the below chart.
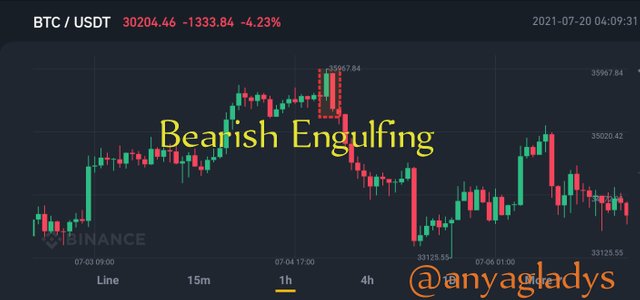
Binance
Doji Candlestick pattern
- Dragonfly Candlestick Pattern.
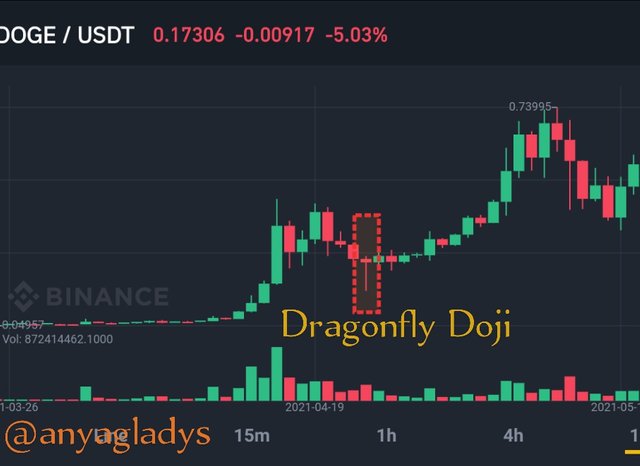
Binance
As we all know according to the explaining of Prof. That Dragonfly candlestick pattern gives the signal of a bullish reversal pattern, especially, when occurring in a downtrend.
As we can see in the above screenshot how there was a turnaround in price after the formation of a Dragonfly candlestick pattern, which occurs in a downtrend.
- Gravestone Candlestick pattern.
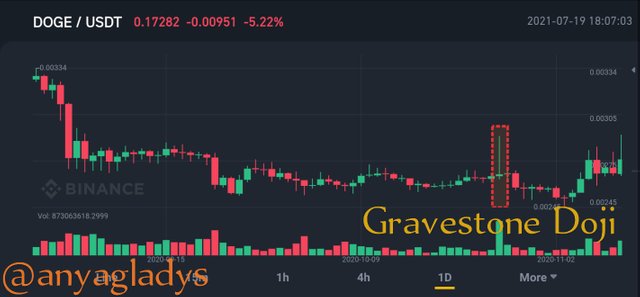
Binance
Gravestone candlestick pattern is a that go in the opposite direction of a dragonfly. It is a pattern that signals a bearish reversal in price, especially when it occurs in an uptrend.
According to the above image, we can see how there was a reversal of price after which the Gravestone candle was formed at the uptrend of the previous candle. There was a reversal in price. That is, the seller was able to take control after the formation of the Gravestone candle.
- Long-leg Candlestick pattern
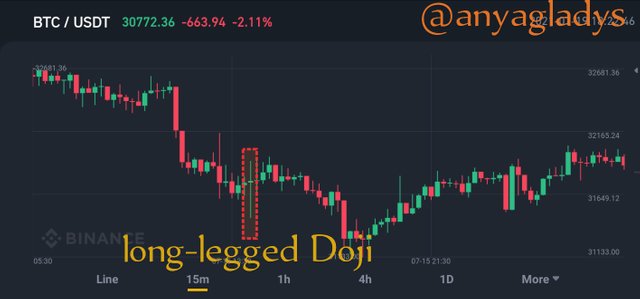
Binance
When this type of candlestick occurs during a price movement, it shows the indecision of the traders (buyers and seller) in the market because the price opens and closes at the same point. So anytime we see this type of candlestick pattern, is best to wait for the next candlestick formation before deciding to avoid unnecessary loss.
This type of candle shows the indecision of the traders. That is, the buyer, not the seller were able to take control of the market price.
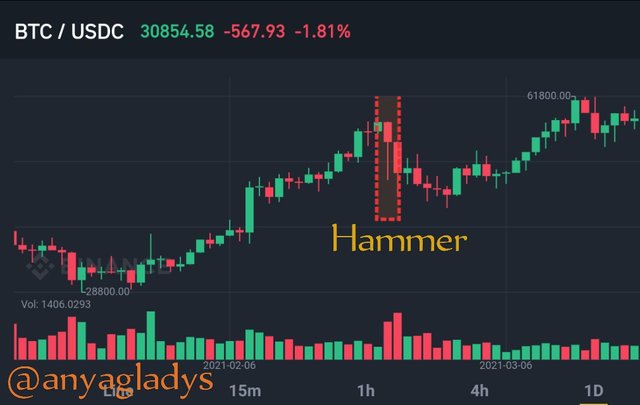
The Hammer candlestick pattern
- Hammer Candlestick Pattern
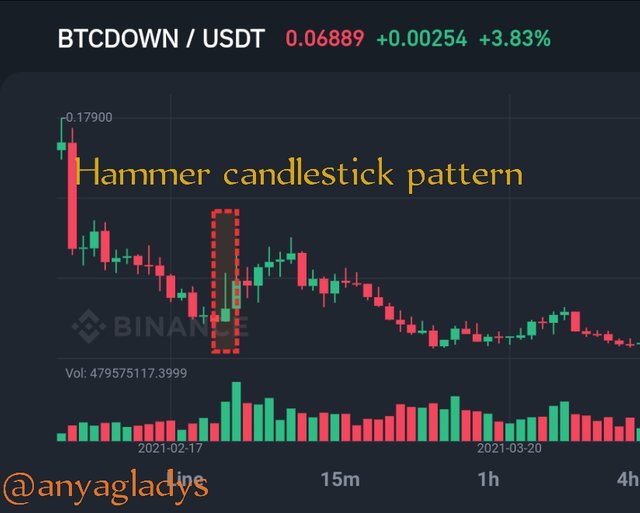
Binance
Hammer candlestick pattern is said to be a strong signal for price reversal when it occurs in a trending market, especially, at a support level.
As it occurs in the above image, it shows that there was a change after the formation of the hammer candlestick pattern. Price reversal occurs in an uptrend after its formation. That is, the buyer was in control of the price after its formation.
- Inverted Hammer Candlestick Pattern
Binance
The inverted hammer is known as a bearish pattern of hammer candlestick pattern. It gives a signal of a bearish/downside/downtrend reversal when it appears in an uptrend.
The above image shows a bearish season after the formation of an inverted hammer candle. That is, the seller was in control after the formation of the candlestick.
The morning and evening star candlestick pattern.
- The Morning Star Candlestick Pattern.
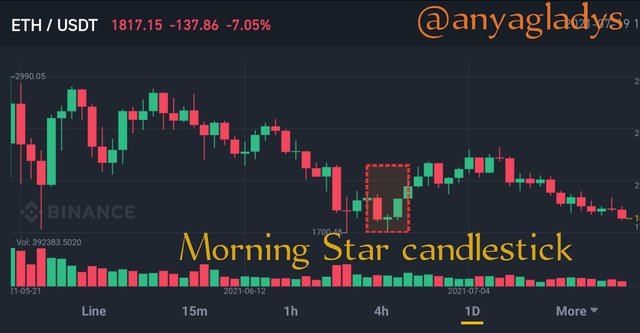 Binance
The morning star candlestick is made of three candles. It gives a strong signal of a bullish reversal candlestick anytime it occurs. But, it gives a stronger bullish reversal when it forms at the support area.
According to the above image of the morning star candlestick pattern, it shows that before there was a downtrend in the market price but the candle before the start of the formation of the morning star candle, shows indecision of the traders (buyers and sellers) over the price. The formation of the morning star candlestick pattern brings about the bullish reversal of the price.
- Evening Star Candlestick Pattern
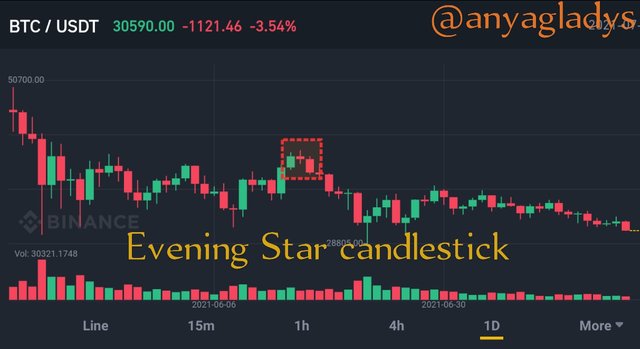 Binance
The evening star candlestick pattern is the opposite of the morning star candlestick pattern. It's also made up of three candles. It gives a strong bearish reversal.
As we can see in the above screenshot, it shows an uptrend (bullish) of the market price before the formation of the evening star candlesticks pattern. But the formation of the evening star gives the signal of a strong bearish reversal of the market price, which occurs. That is, the sellers were in control of the market after the formation of the evening star candlestick pattern.
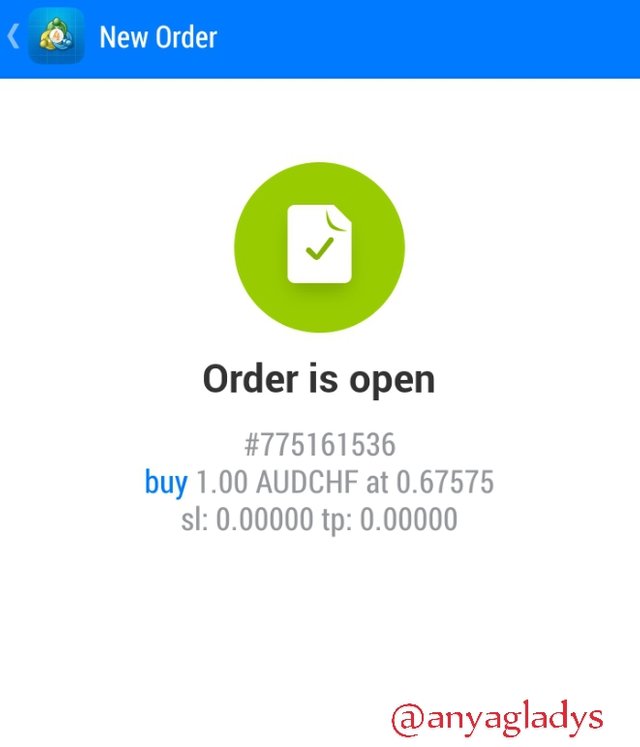
I will be using MetaTrader 4 demo account to open a trade using a bullish engulfing candlestick pattern.
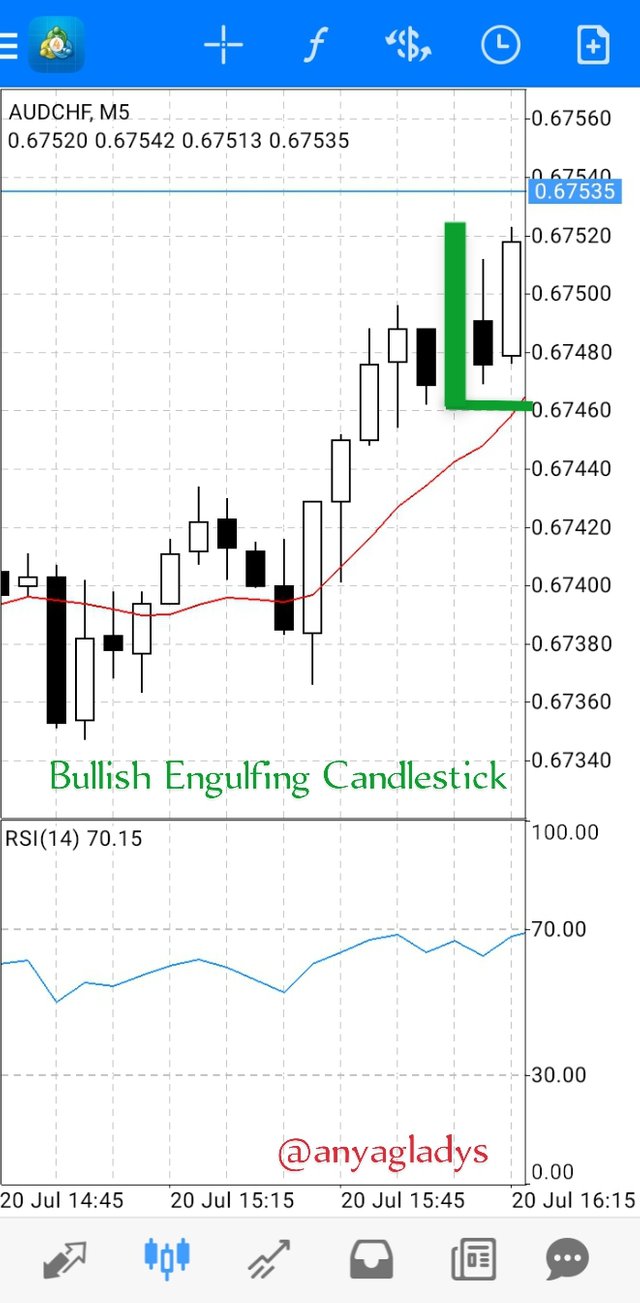
I opened the above position when I saw the signal of bullish engulfing because it engulfs the previous bearish candlestick pattern, and that gives a signal of a bullish reversal.
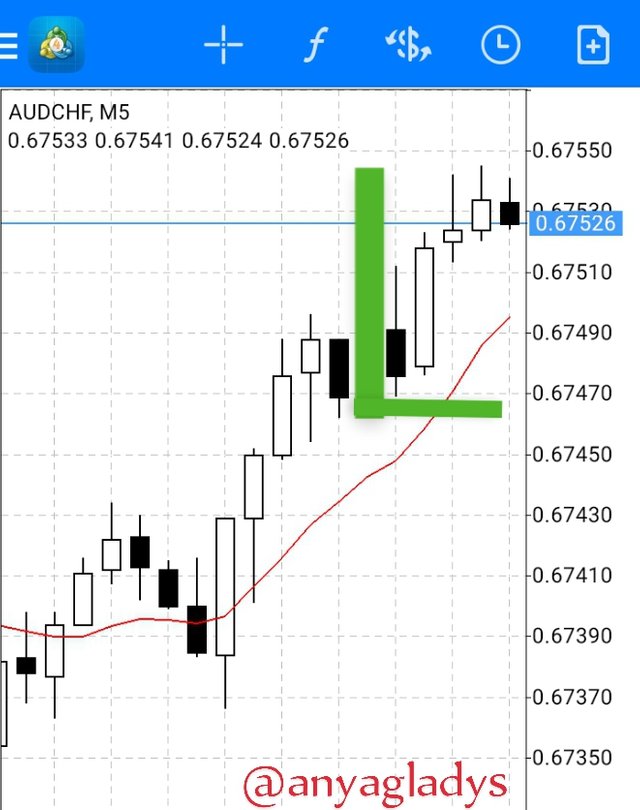
The above image is the result of the candlestick pattern I used to open the position with a time frame of 5minute. That is, the bullish reversal occurs after the formation of a bullish engulfing candlestick pattern.
In conclusion, the candlestick pattern was originated from the Japanese by a rice trader called Munehisa Homma. It is a technical analysis trading tool that has been a very good helping hand for traders that use technical analysis in the analysis market. It is a tool that has been used for centuries to predict price direction.
I want to use this opportunity to thank everyone that will be reading my homework. Especially, Prof. @reminiscence01 for tutoring us on this wonderful topic.
Hello @anyagladys, I’m glad you participated in the 4th Week of the Beginner’s class at the Steemit Crypto Academy. Your grades in this task are as follows:
Recommendation / Feedback:
Thank you for completing this homework task.
Thank you