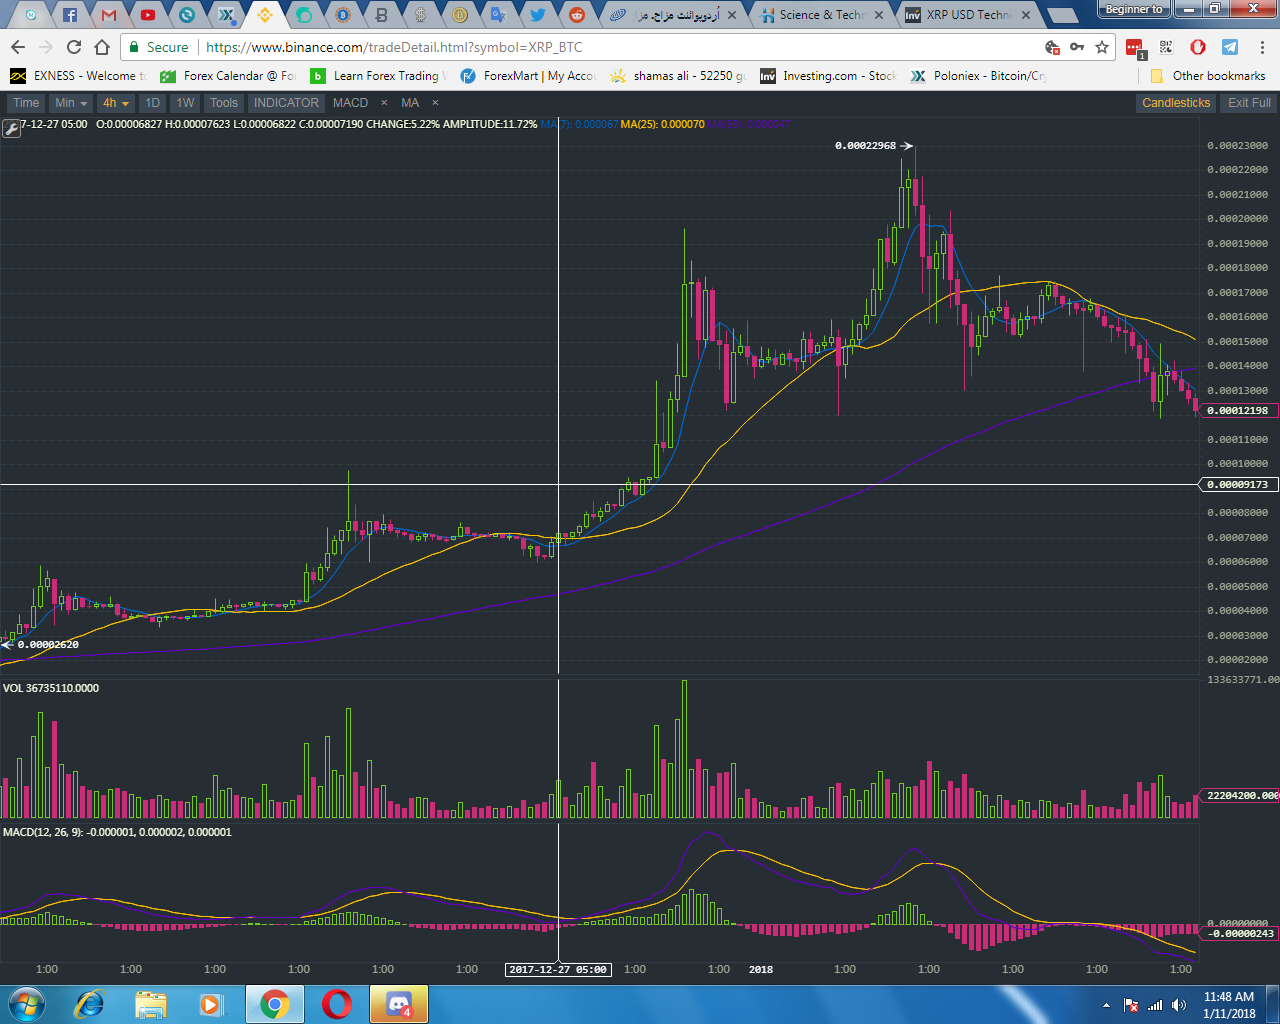
Ripple Technical analysis on the base of 1 hour chart
todays is also a ripples blood bath day but we analyse that what going to next on the base of 1 hour chart time frame
today pivot point are 1.603 with support level 1.509 and i think it is strong support level with both technically and phyco too so i hope price did not going to below 1.509 level so b patient and hold
overall today overview is basis of all technical indicator
1st RSI14 sell
2nd stoch 9/6 sell
3rd macd 12/26 sell
3th ADX sell
5th cci sell
6th ATR sell
7th osilator sell
8th bull & bear sell
9th MA5/10/20/50/100 all sell
over all summary occurding to all indicator and moving averages is strong sell
but here one thing is on price action the cadle sticks pattrens
if we see xrpusd chart care fully we find some thing most amazing last 5 candle sticks pattren they are all bullish
1 bullis doji star
2 morning doji
3 bullish engulfing
4 bullish doji
5 bullish engulfing
all these 5 pattrens show that ripple have a potential to to a bull session and on market sentimental i hope so too just two or 3days and xrp again moon