Ripple - trading idea of May 1, 2018
Nice ascent to Ripple. We are at the height of an uptrend that began on 11 April and now seems to have come to an end to a corrective phase that could give a new impetus for the next leap that would bring Ripple to test again the psychological level of 1 US dollar.
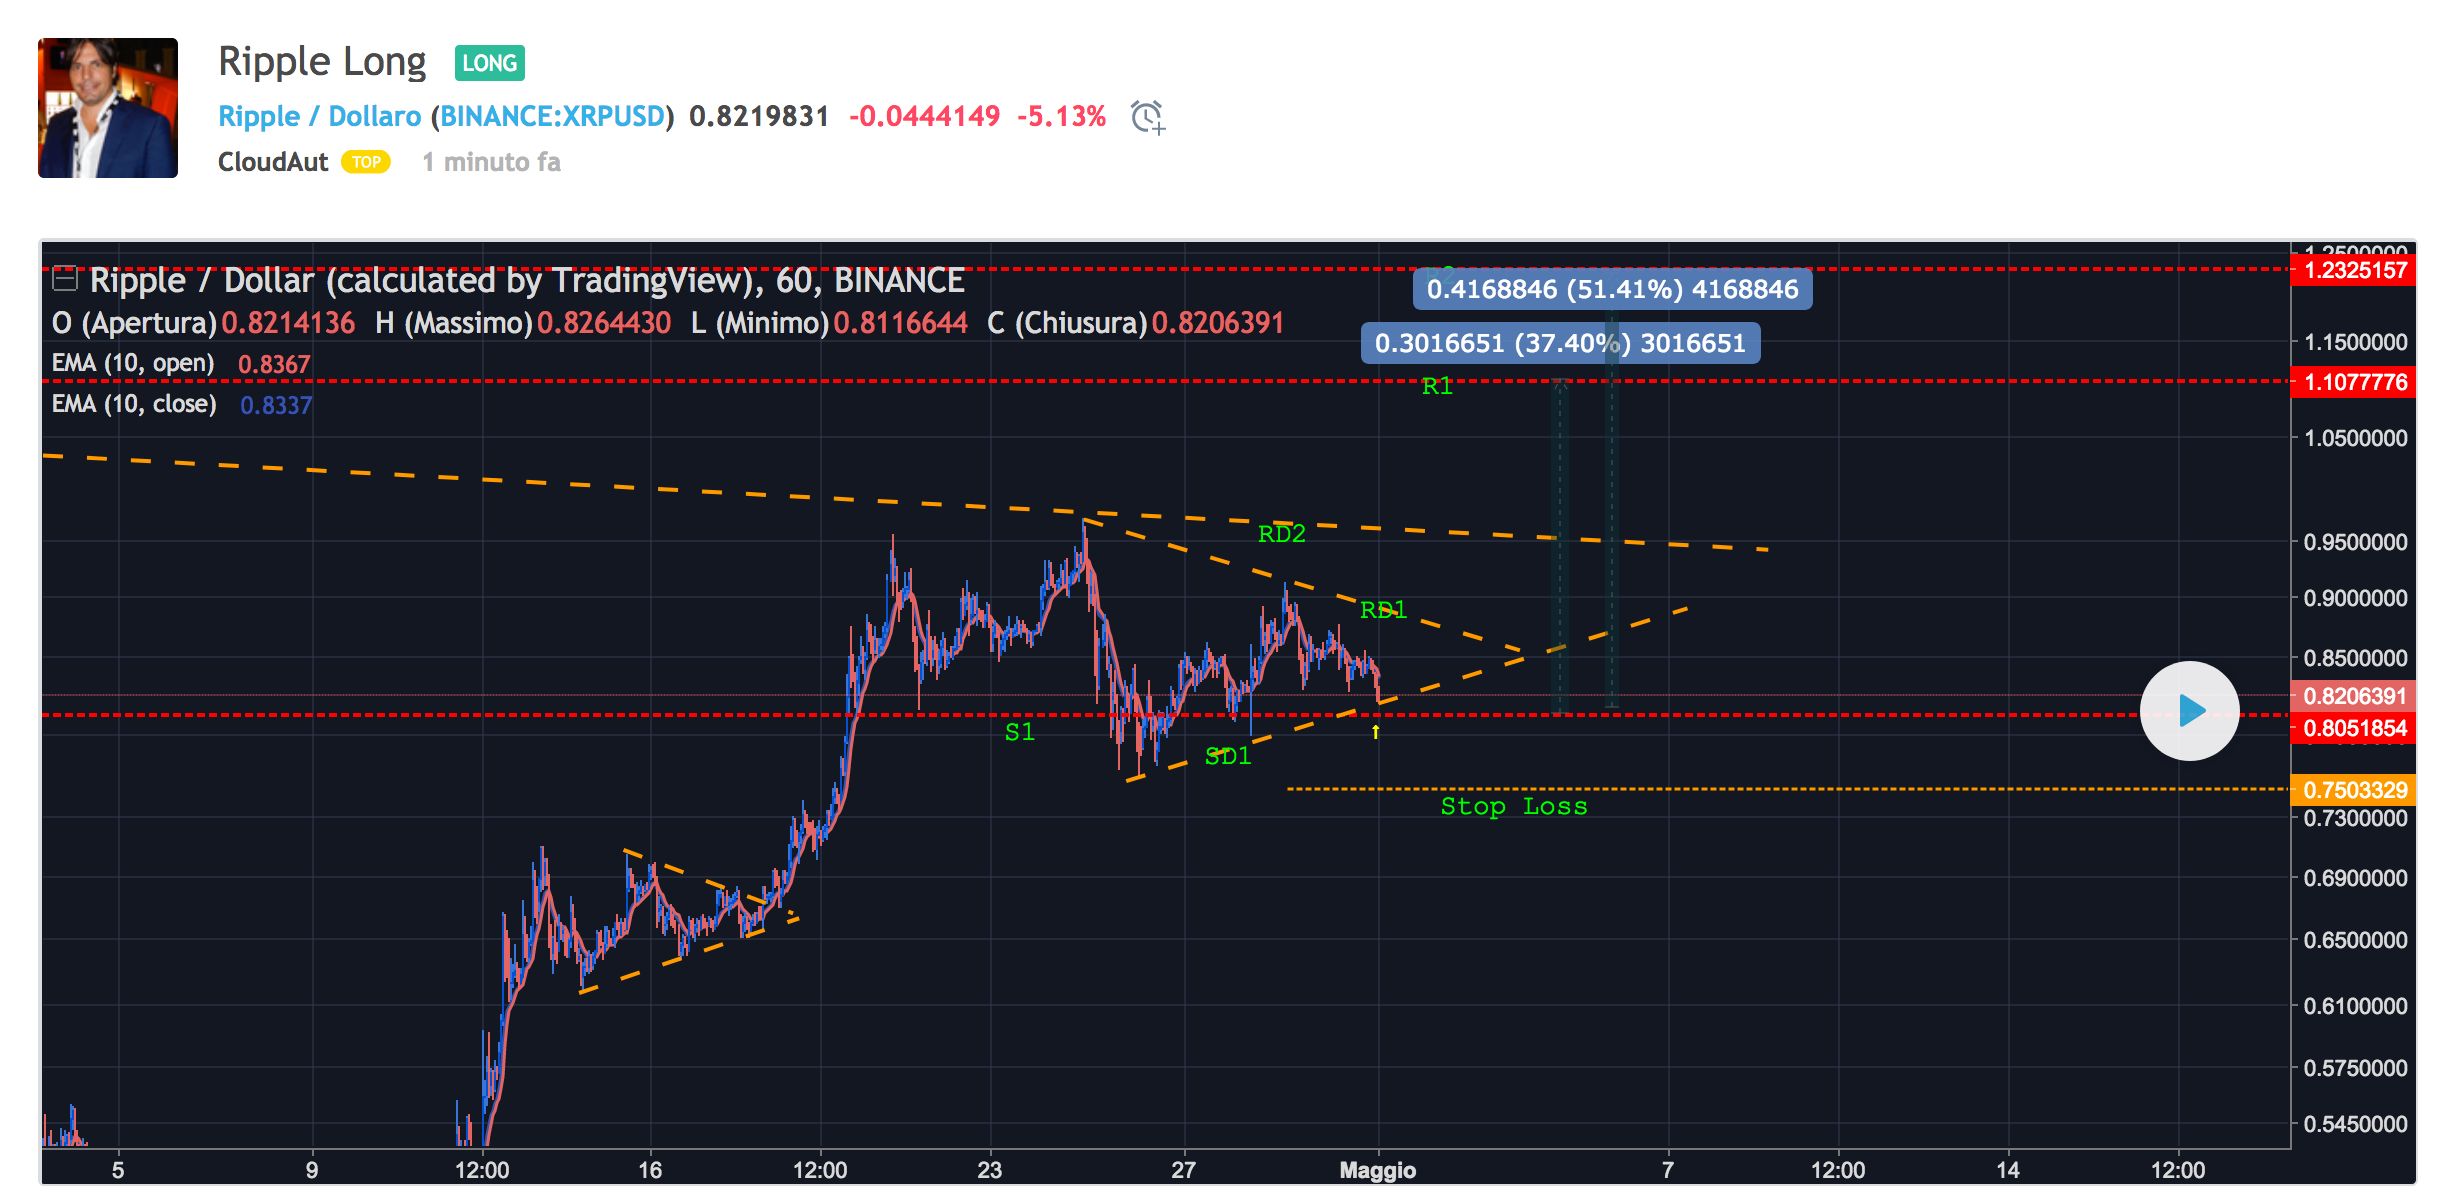
In the graph I have indicated to the left a triangle very similar in conformation to what is being completed right now. A sort of double maximum and then start a corrective triangular phase that took him from 0.65 USD to 0.95 USD in just two days.
Now the time to get long seems really interesting. We are on the crossing of the S1 support with the SD1 dynamic support as indicated by the yellow arrow.
In my analysis I indicated a stop loss level, as it should be, and two targets, R1 and R2, the first right on the psychological threshold of 1 USD and the second a little later. It is interesting to note that achieving the first goal would bring me a profit of 37% while achieving the second one a profit of 50%.
As always, we'll see. It is important to always cover yourself in these operations with stop loss because with criptovlute we know the volatility could be very high and therefore it is good to keep your portfolio always under control.
This is a simple trading idea and should not be confused with an investment advice.
Ripple - idea di trading del 1 maggio 2018
Bella risalita per Ripple. Siamo al culmine di una fase rialzista iniziata l'11 aprile e che adesso sembra essere giunta alla fine di una fase correttiva che potrebbe dare nuovo slancio per il prossimo salto che porterebbe Ripple a testar nuovamente il livello psicologico di 1 dollaro statunitense.
Nel grafico ho indicato più a sinistra un triangolo molto simile per conformazione a quello che si sta completando proprio adesso. Una sorta di doppio massimo per poi iniziare una fase triangolare correttiva che lo ha portato da 0.65 USD a 0.95 USD in soli due giorni.
Adesso il momento per entrare long sembra davvero interessante. Siamo sull'incrocio del supporto S1 con il supporto dinamico SD1 come indicato dalla frecciata gialla.
Nella mia analisi ho indicato un livello di stop loss, come è giusto che sia, e due target, R1 ed R2, il primo proprio sulla soglia psicologica di 1 USD e il secondo un pò più avanti. È interessante notare come il raggiungimento del primo traguardo mi porterebbe un profitto del 37% mentre il raggiungimento del secondo un profitto del 50%.
Come sempre staremo a vedere. È importante coprirsi sempre in queste operazioni con degli stop loss perché con le criptovlute lo sappiamo la volatilità potrebbe essere davvero elevata e pertanto è bene tenere il proprio portafoglio sempre sotto controllo.
Questa è una semplice idea di trading e non deve essere confusa con un consiglio di investimento.
You can follow me on:
Tradingview: https://it.tradingview.com/u/CloudAut/
My website : https://www.piattaformetrading.eu
Canale Telegram: Top Investments
You got a 1.39% upvote from @postpromoter courtesy of @cloudaut!
Want to promote your posts too? Check out the Steem Bot Tracker website for more info. If you would like to support the development of @postpromoter and the bot tracker please vote for @yabapmatt for witness!
Amazing post! I love it. Hey UPVOTE my post: https://steemit.com/life/@cryptopaparazzi/chapter-one-let-there-be-the-man-and-there-was-a-man-let-there-be-a-woman-and-there-was-sex and FOLLOW ME and I ll do the same :)