Ripple [XRP] Price Analysis (16/11/2020)

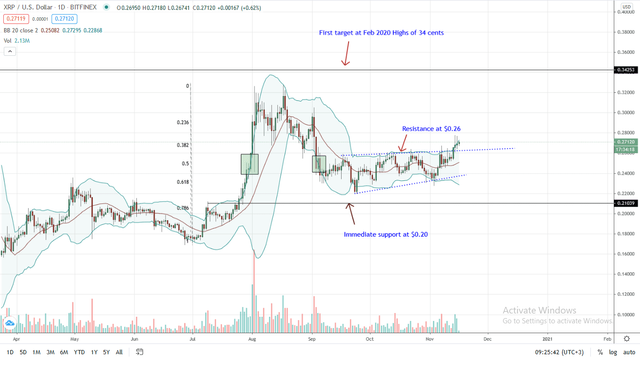
The Ripple price is trading at a 2-month high after last week’s break and close above a primary resistance trend line visible in the daily chart.
At the time of writing, the Ripple price is up six percent against the USD, outperforming ETH and at break-even with BTC in the last week of trading.
Candlesticks’ arrangement in the daily chart suggests weakness. Notably, the last two bars are with long upper wicks. This hints at possible sell pressure in lower time frames. The short lower wicks could mean weak bulls and buy pressure.
The Ripple price is beginning to band along with the upper Bollinger Band (BB). As a volatility and momentum indicator, it is sensitive to price movements. Higher highs and banding along the upper BB may spark more demand, pushing prices towards Aug 2020 highs as the positively inclining 20-day moving average (middle BB) acts as flexible support.

If you wanna see the complete article please follow the link:
https://crypto-economy.com/bitcoin-btc-price-analysis-soars-above-16300-despite-pfizer-vaccine-news/
From Crypto-Economy we work to bring the latest news, news, analysis, tutorials and everything related to Blockchain and Cryptocurrencies that may be useful for our users.
In our Blog we will share fragments of the most outstanding news and if you want to read the full article we welcome you to visit our page.
All the content show here is our own
![]()