RIPPLE (XRP): The Rally Path

SUMMARY
Everyone beats on Ripple because they say it's the evil bankster coin....regardless, it adheres to the culmination of pattern, Elliott Waves and indicators. The below chart shows that the weekly MACD is flattening and that is being led by the higher lows of the historgram. The next likely step will be for the white line to start curling upwards.
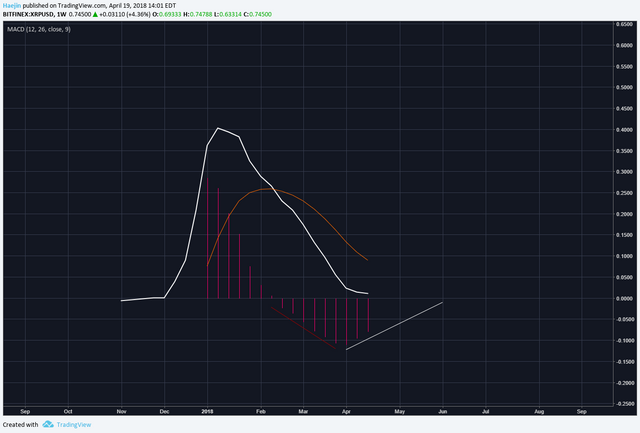
The projected pathways of the moving averages could target a potential buy signal at around June or so.
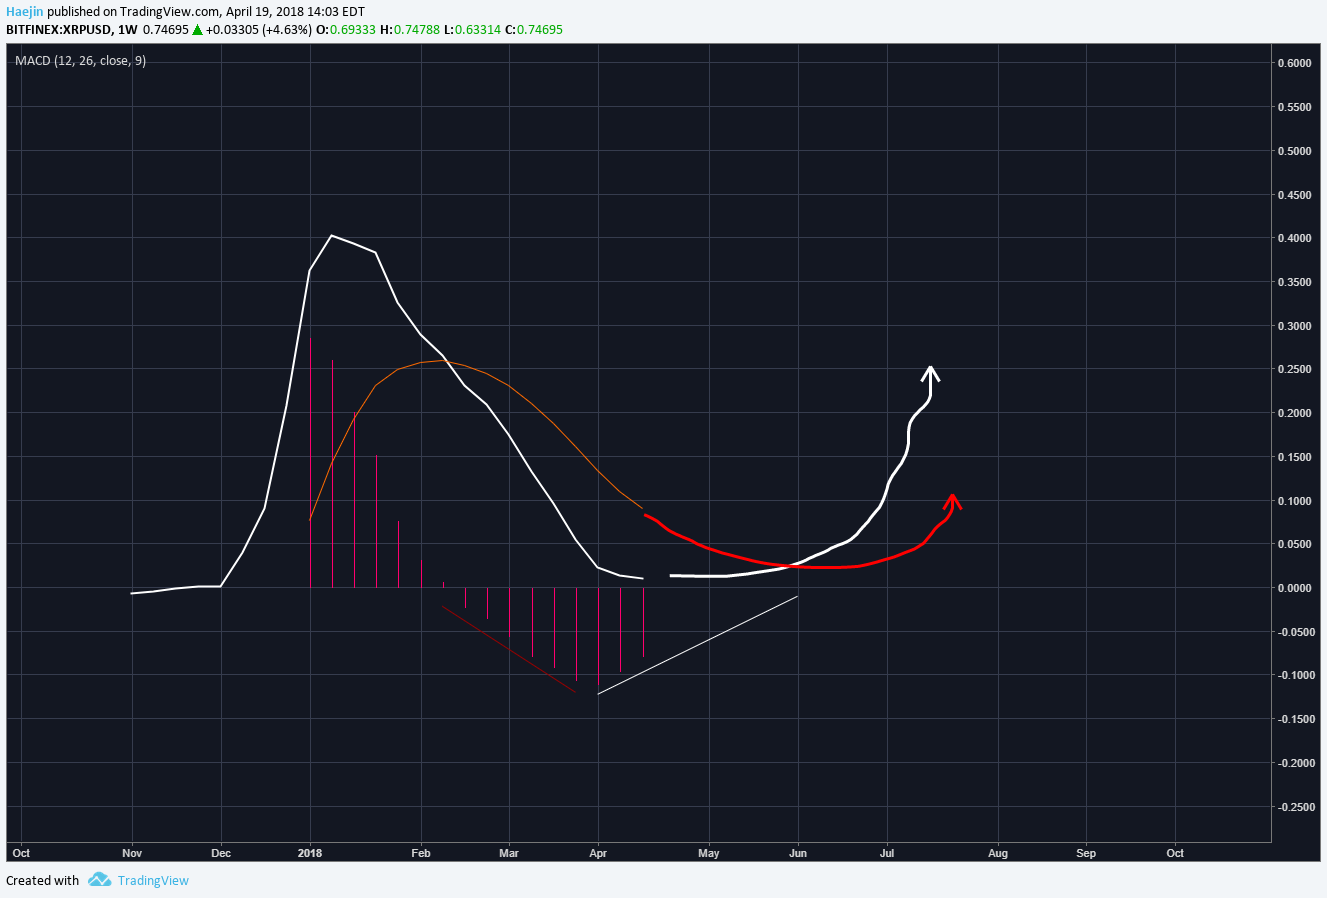
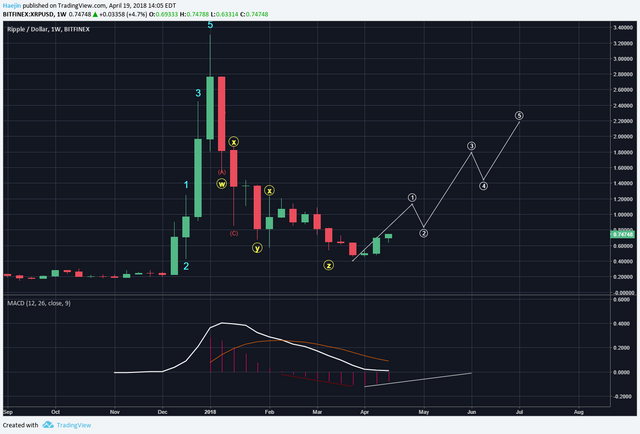
The price should rise and keep rising in an impulse driven manner. The vigor of the rise will likely become more violent into June, which is when wave 3 should be in progress.
Legal Disclaimer: I am not a financial advisor nor is any content in this article presented as financial advice. The information provided in this blog post and any other posts that I make and any accompanying material is for informational purposes only. It should not be considered financial or investment advice of any kind. One should consult with a financial or investment professional to determine what may be best for your individual needs. Plain English: This is only my opinion, make of it what you wish. What does this mean? It means it's not advice nor recommendation to either buy or sell anything! It's only meant for use as informative or entertainment purposes.
Please consider reviewing these Tutorials on:
Elliott Wave Counting Tutorial #1
Elliott Wave Counting Tutorial #2
Elliott Wave Counting Tutorial #3
Laddering and Buy/Sell Setups.
Laddering Example with EOS
Tutorial on the use of Fibonacci & Elliott Waves
@haejin's Trading Nuggets
Essay: Is Technical Analysis a Quantum Event?
Follow me on Twitter for Real Time Alerts!!
Follow me on StockTwits for UpDates!!
--
--


Riple pumps are realy strong always
@bitcointravel, if you continue to support @haejin you will get shit on just like Kim Jong Un shitting on @haejin!
@haejin you make great toilet, just like your TA!
Thanks @haejin
I mapped out a potential price pathway on a shorter term basis.
Check it out:
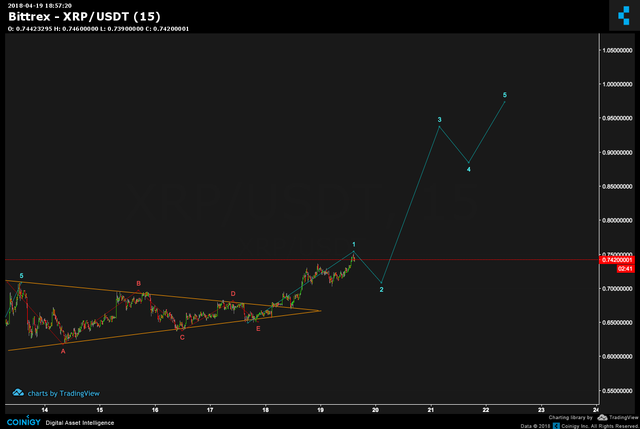
and on a 15 minute chart, I see this:
Any chance to get this images in higher resoltion?
I couldn't read your targets. but with a right click I could open the pictures. Sorry was a user mistake of mine. Nice TA Thans - i will follow you.
You just have to zoom your screen through your browser, then put back to normal after viewing the charts.
Thanks for this Tipp!
what do you mean? its blurry? or just a smaller candle chart?
likes this?
Nice @cryptosuf @haejin
But I don't expect anther triangle since wave 2 and 4 should have different type of correction.
I'm trying to understand this aWcYXZ correction but I can't. What happens after c in terms of subwaves?
Another general question:
From point 0 to X is always abc?
This is a nice, useful and wonderful topic. And I always like these topics and looking for them, thank you and waiting for your next topics accept my words @haejin
best app for view cryptocurrency stats and signals https://usignals.com
Whoo. Let's get it! I can feel the profits coming!!!
@tntdabomb, if you continue to support @haejin you will get shit on just like Kim Jong Un shitting on @haejin!
@haejin you make great toilet, just like your TA!
Lol chill. I'm not in your little petty wars on steemit. I just get excited whenever Ripple is mention. Leave us minnows out of your "shit". Get it? I'm funny.
Ripple is what it is. Any commodity traded would follow a pattern.
YES! XRP and DGB baby!
I think the rise is inevitable. Its just when. https://www.cryptocoinviz.com/currency/ripple-xrp
Looking at the 30 min chart, I see a clear path to $0.85 within the next couple days IF volume remains strong and bitcoin doesn't drop below $8,000. I outlined the details here if you're interested:
https://steemit.com/cryptocurrency/@workin2005/ripple-update-path-to-usd0-85-is-possible