You are viewing a single comment's thread from:
RE: Ripple (XRP/BTC): Leading the alts
That was a great call and it has certainly broken out of the bear trend. With so man of the cryptos looking like they are reaching the apex of their bearish triangles, it looks like a sustained bull might be just around the corner..
@luiggih, I want to continue a question I recently asked. On the second to last graphic, you show the downscoping line (I'm half color blind but think its a brown line...) that is below a bunch of peaks. Is this a mistake or can you explain why the line is able to be placed not touching the peaks of the Ripple price curve?
Are you talking about this chart?
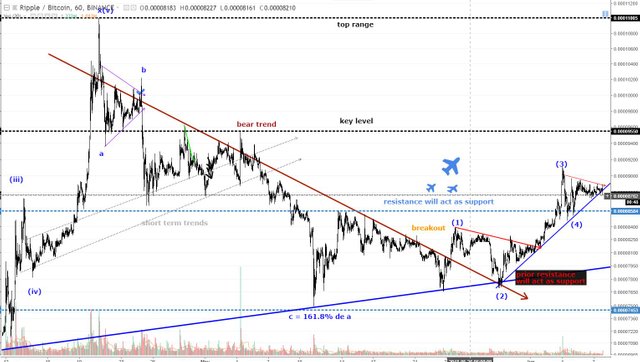
Which line?
Yes. And I'm asking about the line that has an arrow at its end at the apex of the triangle. I thought you place the line on the peaks of the curve... I want to learn otherwise, how you selected the location of the line. Thank you.
The bottom line? That's selected from a prior point of the price chart. Just extended. The main point is that is connecting the three recent bottoms.
No, the top line. It cuts through peaks and instead of touching the peaks of the price data. I'm wondering why? If its correct, can you explain how you know to place it not at the peaks? Sorry if I'm not being clear. I'm trying. I promise:)