RRT (RRT) Fractals Can Guide Future Price Pathway Discernment

SUMMARY
Note: Rightfully reposting as Trolls have made invisible with downvotes.
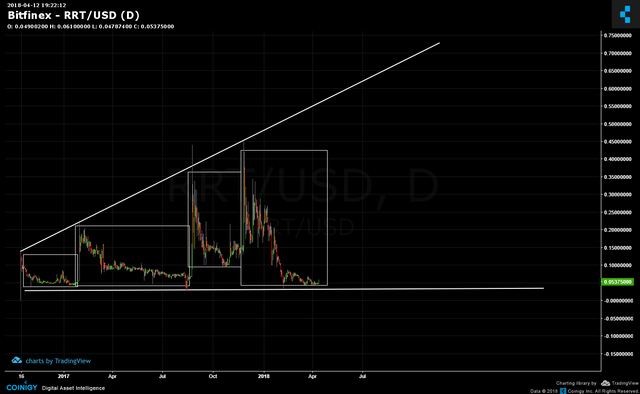
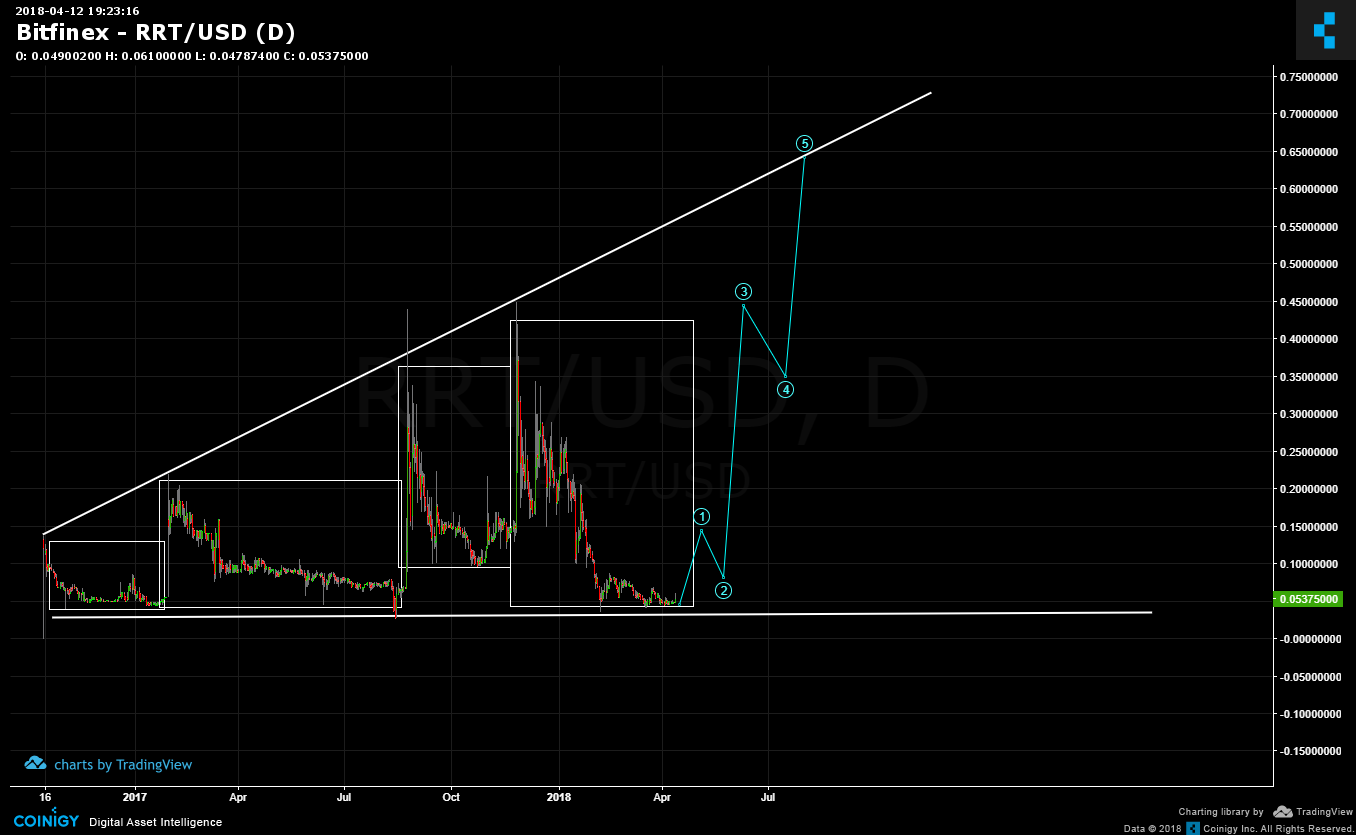
Here is a chart of RRT with its broadening pattern. Note the series of squares marking out the fractals. Each fractal reached for the top trenline and decline to the bottom. Where is the price currently? It's sitting on the lower trendline. So would now be the ideal time to take SELL actions or BUY action?
Using the preponderance of evidence, the blue impulse waves show the projected pathway towards the upper trendline and the time line is into July/August. The ascent seems quite vertical and that's quite normal given the Hurry Up & Wait syndrome. All impulses are near vertical and quick while the corrections are very long.
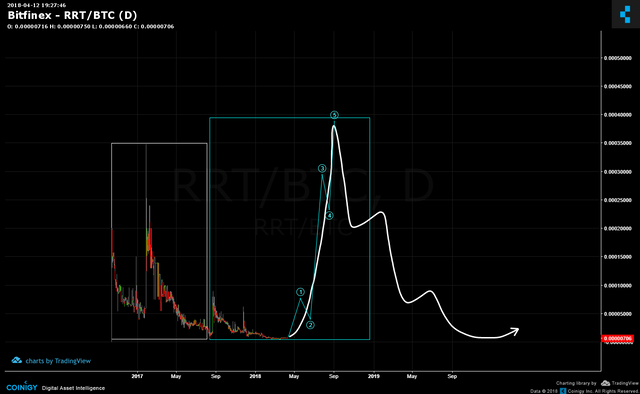
Here is the RRT/BTC pair. Again, fractals abound! The white square shows a pair of downward wedges, a small and a large. The blue box thus far only contains the small wedge and per fractal, a larger wedge could be formed. The white arrow shows the near vertical ascent in five blue impulse waves and the decline to complete the larger wedge. Would now be an ideal time to buy or sell RRT?
Legal Disclaimer: I am not a financial advisor nor is any content in this article presented as financial advice. The information provided in this blog post and any other posts that I make and any accompanying material is for informational purposes only. It should not be considered financial or investment advice of any kind. One should consult with a financial or investment professional to determine what may be best for your individual needs. Plain English: This is only my opinion, make of it what you wish. What does this mean? It means it's not advice nor recommendation to either buy or sell anything! It's only meant for use as informative or entertainment purposes.
Please consider reviewing these Tutorials on:
Elliott Wave Counting Tutorial #1
Elliott Wave Counting Tutorial #2
Elliott Wave Counting Tutorial #3
Laddering and Buy/Sell Setups.
Laddering Example with EOS
Tutorial on the use of Fibonacci & Elliott Waves
@haejin's Trading Nuggets
Essay: Is Technical Analysis a Quantum Event?
Follow me on Twitter for Real Time Alerts!!
Follow me on StockTwits for UpDates!!
--
--


Verry nice post big thumbs up and a resteem from my side for hard work and dedication.
It's just a matter of time before this goes up. The upside potential is far greater than the downside. It will be moving on up, like the Jeffersons.
so nice post its very usefull postThanks you so much for your great postAll the best
Bitcoin is our future best currency ! THANKS For share this information.
sir we need more post about this! best of luck. good wishes to you.
Looking at the charts and taking your advise into account. If I was holding I would sell right now just before the decline, then buy later on, as you said it should be on the high around July/August too. So I would sell, wait for the decline, then buy the dips.
upvoted you.
I want to ask you one thging that in Fractals there is a recurring pattern and the pattern is same as before. Pattern coming out of patterns.
where is it in this graph.
I sincerely hope for the appreciation from you and we want also our reputation goes up so please please help me
Oga boss,make you help your boy now...