You are viewing a single comment's thread from:
RE: SBD update 13.01.19
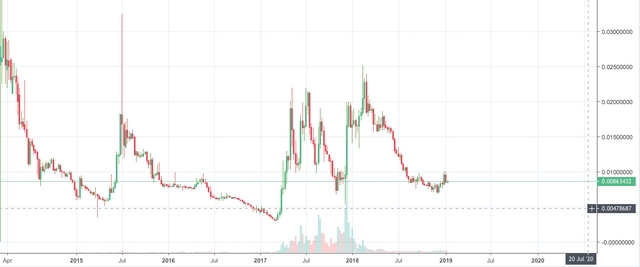
However, with a pair like LTC/BTC, there are no clear larger fractals since the prices just keeps oscillating without any clear direction. It would be hard to put a impulse wave count on the longer time frames. How would you figure out the count on a smaller time frame then?
To me, this looks like the perfect example of a large genesis wave. A count does not have to start with an impulse. In fact, most charts start with an ABC or WXY or WXYXZ before an impulse wave is formed.
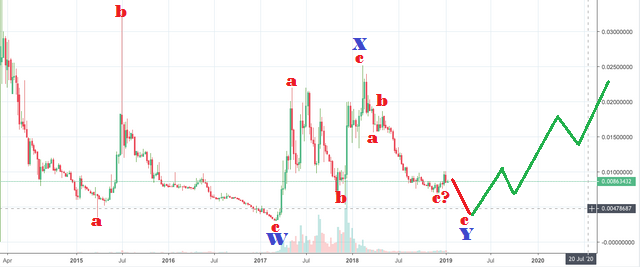
Until you have figured out the count for the big pic, it is nearly impossible to count this on the smaller time frames.
However, with Elliott waves, there will eventually there will be impulse waves after the correction is over. With impulse waves, we assume that the price goes up forever in the long run. In the long run, all coins (that still exist) then would either go up forever against Bitcoin (or go down forever if the impulse waves are down).
The other possibility is that the WXY are just part of a larger WXY and the correction lasts forever.