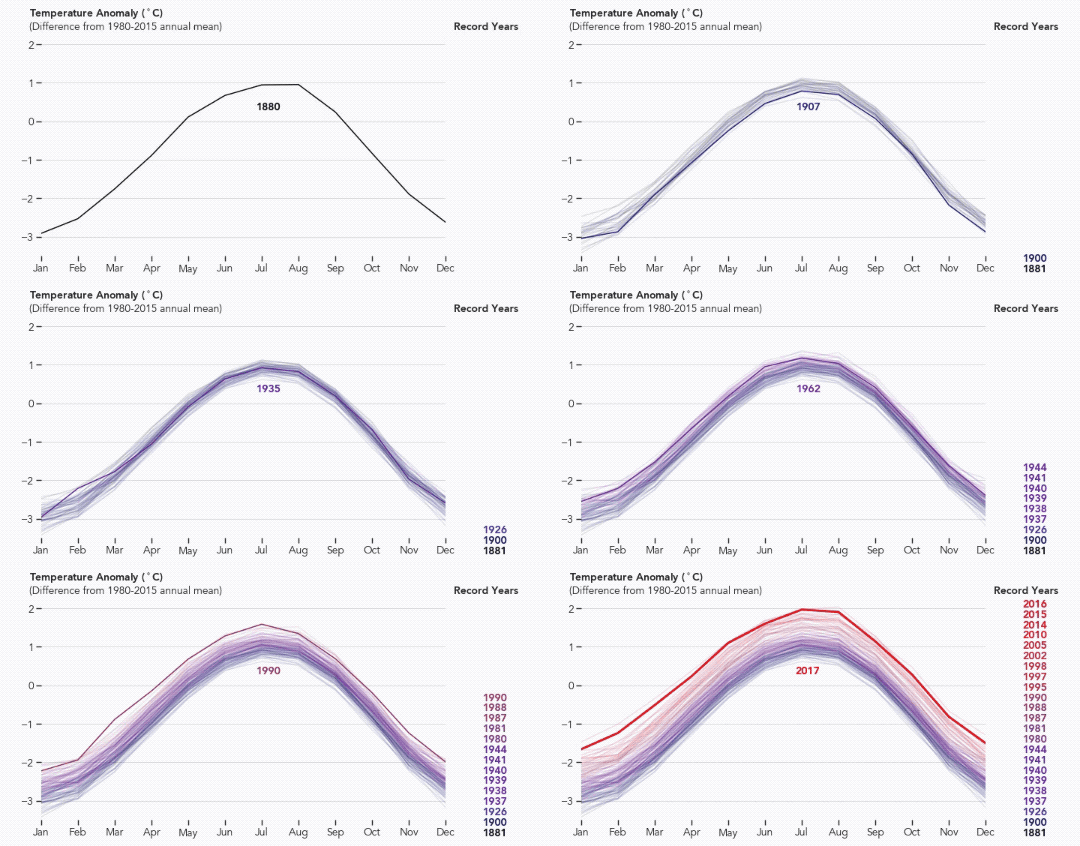
This kinda says it all!
Each time we have record global temperatures the year its recorded and the seasonal curve plotted in this animation by Nasa.
Notice that the last couple of years the divergence has been progressively greater.
Seems like we may have hit a tipping point. Possible even a point of no return since feedback mechanisms have kicked in.

Lol, lets just forget about the other ~ 5,499,998,119 years huh?
scientifically speaking sample of 100 years says absolutely nothing...im not taking sides here but since you tagged it "science" i beg to differ...trying to come to any conclusion based on this feels like trying to prove a point without almsot any evidence:)
This graph simply depicts the measuring of the pulse, there is a mountain of good data behind this diagnosis stretching back millenia via ice cores, paleo-climate data, speleothems etc. etc.
I don't trust NASA. I think most of what they produce regards to climate is total bs.
These unusual peaks are really concerning. Analysis or not, changes are considerable.
We have in Siberia all week every day at -44 degrees! 😞
I can believe that