Lightning EMP Detected with JRAN-SUPER-ESUV-30K
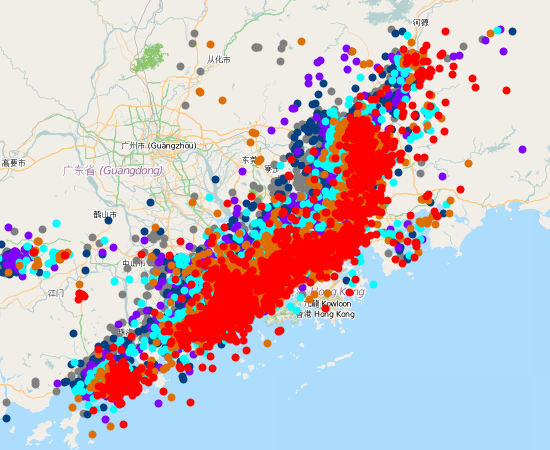
Figure 1: Lightning Strikes Near Hong Kong
Introduction
The lightning storm approached Hong Kong on 20 April 2019. Figure 1 shows the storm just north of Hong Kong. The red dots are lightning strikes within the last 5 minutes. The extent of the storm was vast and the intensity of the strikes was huge as you can see. It approached with great ferocity. We could hear it coming our way and see flashes of light in the clouds overhead from distant strikes. The data is taken from the Hong Kong Observatory weather imagery.
The antenna used was the JRAN-SUPER-ESUV-30K by Jackson Research. The spectrum analyzer software was Spectrum Lab. All of the following images are screen captures of live data.
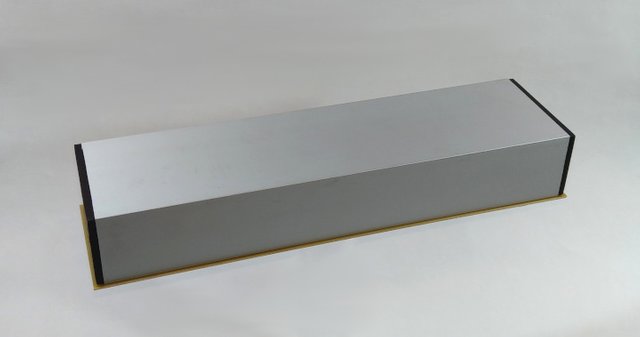
Figure 2: JRAN-SUPER-ESUV-30K
The Data
The horizontal streaks in the scrolling waterfall are the lightning EMP flashes. There is one very strong pulse shown in Figure 3 which was near to our location. The spectrum itself will bounce up during the flash and can only be easily seen on the waterfall. The more faint horizontal traces are distance strikes.
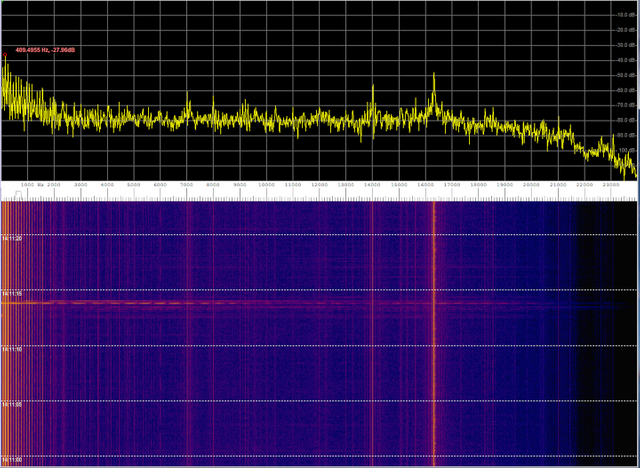
Figure 3: The Approaching Storm Spectrum for Figure 1
As the lightning storm moves over head, the intensity of the horizontal lines increases as seen in Figure 4. The frequency of lightning EMP strikes can be easily seen in the numerous visible lines. The very strong lines are near strikes with very loud rumbling thunder.
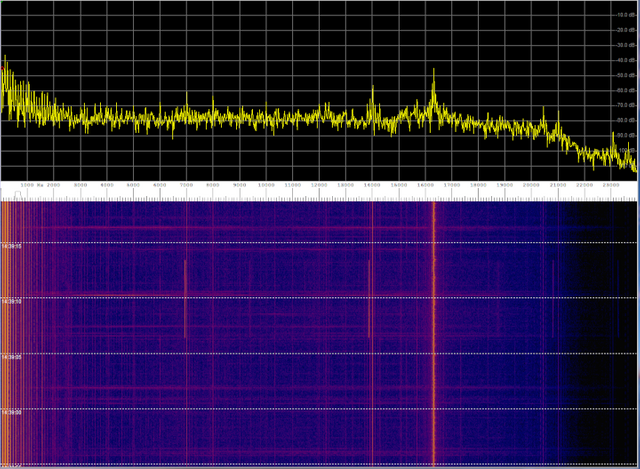
Figure 4: Overhead Lightning
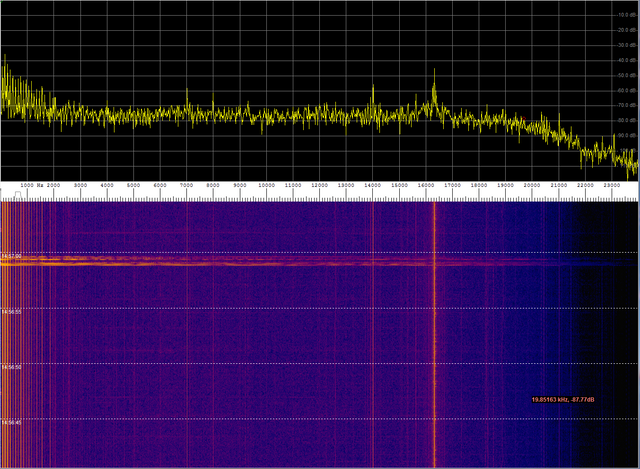
Figure 5: Storm Moving Away
As the storm started moving away, the intensity of the horizontal lines diminishes with one very powerful strike over head as shown in Figure 5.
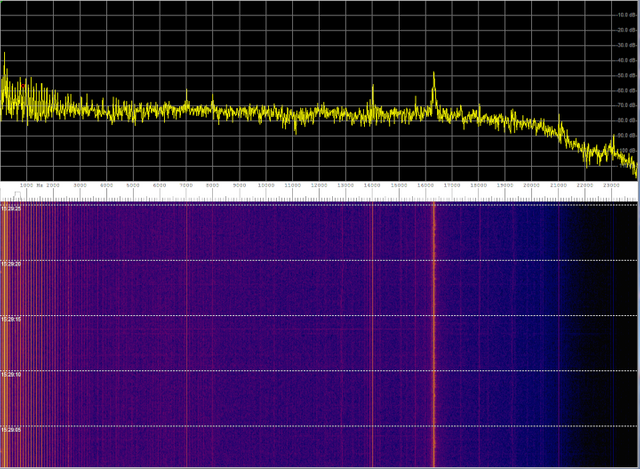
Figure 6: Storm South of Hong Kong
The storm has now moved out of range as can be seen in Figure 7 with the faint EMP lines showing in Figure 6.
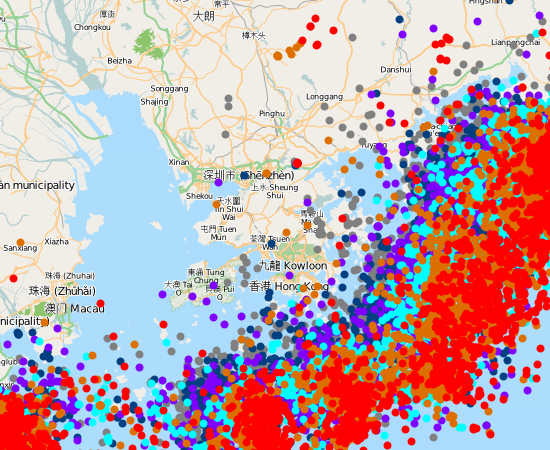
Figure 7: Lightning Storm South of Hong Kong
Conclusion
There were multiple lightning strikes continuously during the storm detected by the antenna as displayed by the spectrum waterfall and as shown by the Hong Kong Observatory charts. This is easily seen in the density of horizontal lines showing in the waterfalls. The intensity of the lines increases as the storm moves overhead. Near lightning strikes are the most intense which we know from the very loud thunder. Some of the close near strikes made the windows vibrate.
Larger magnetic loop antennas are used by the Hong Kong Observatory in pairs to measure the strike geographic vector. They are also set up in arrays throughout the region to fix locations of the strikes.
I could improve the range of my antenna by using an external amplifier. Using two antennas would have enabled me to fix a location vector, but not range. That data would have to be correlated to other antennas at other locations to fix the position of the strike by triangulation.