Lightning Spectra Structure Characteristic of Stochastic Processes
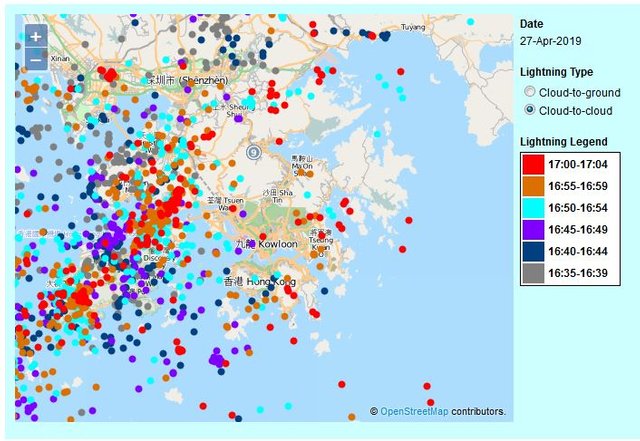
Figure 1: Hong Kong Observatory Lightning Strike Imagery
Introduction
The lightning storm approached Hong Kong on 27 April 2019. Figure 1 shows the storm approaching from the north. The red dots are lightning strikes within the last 5 minutes. The spectra of many lightning strikes were observed wherein a fine structure was discovered. This fine structure appears to be stochastic as compared to similar spectra displayed in class notes by Germain Drolet [1].
The antenna used was the JRAN-SUPER-ESUV-30K by Jackson Research, Figure 2. The spectrum analyzer software was Spectrum Lab. All of the following images are screen captures of live data.
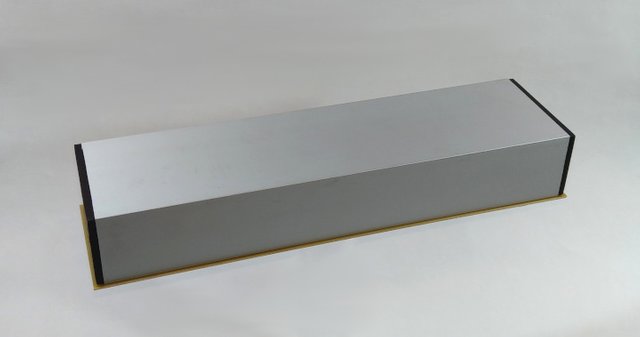
Figure 2: JRAN-SUPER-ESUV-30K
The Data
The horizontal streaks in the scrolling waterfalls, shown in Figures 3 through 6, are the lightning MEMP flashes. The strikes were selected from a collection that most clearly illustrated the spectrum fine structure. The spectrum itself will bounce up during the flash and can only be easily seen on the waterfall. These were all cloud to ground strikes.
The spectra range from 1 KHz to 24 KHz and the vertical scale is set from -100 db to -30 db.
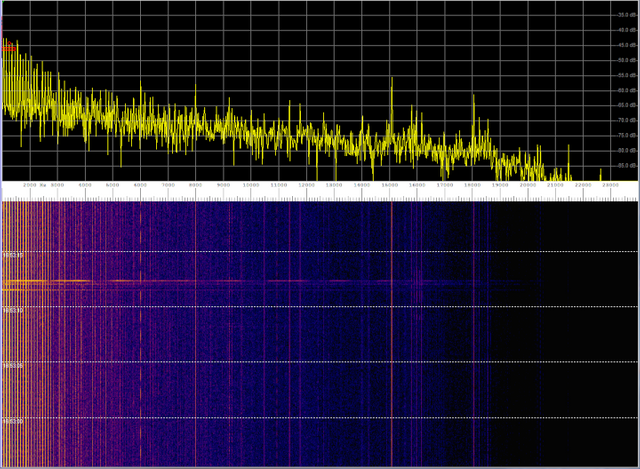
Figure 3: Lightning Strike Fine Structure
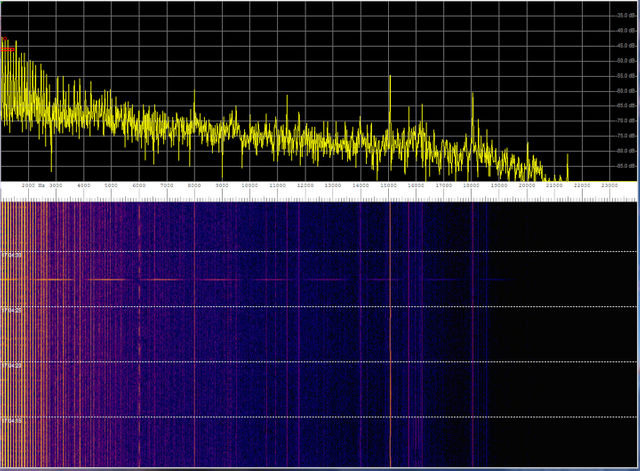
Figure 4: Lightning Strike Fine Structure
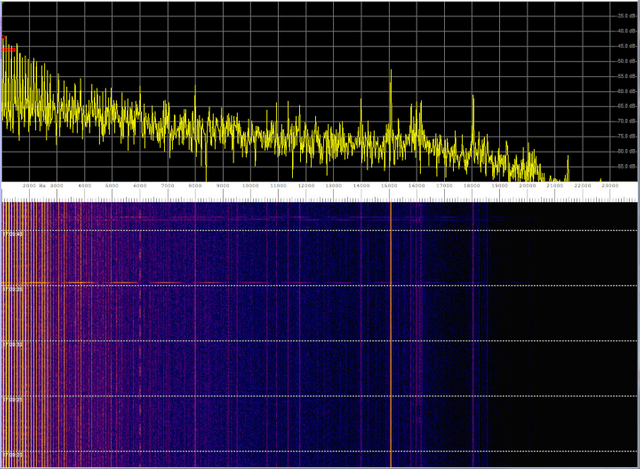
Figure 5: Lightning Strike Fine Structure
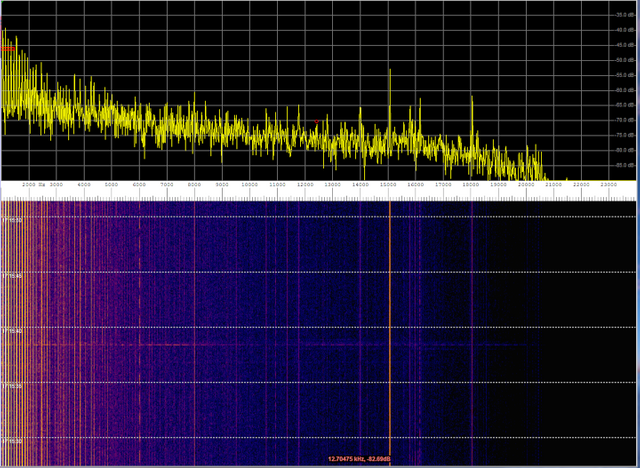
Figure 6: Lightning Strike Fine Structure
Upon close examination, it can be easily seen from the waterfalls in Figures 3 through 6 that the spectra resemble that shown in Figure 7. Analysis of recorded signals shows this structure clearly.
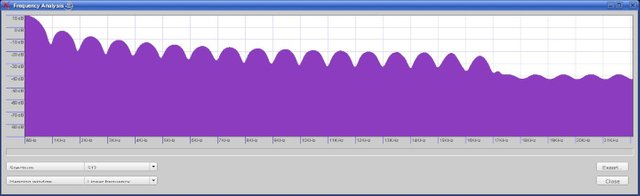
Figure 7: Lightning Characteristic Spectrum
Conclusion
There were multiple lightning strikes during the storm detected by the antenna as illustrated in the spectrum waterfalls and as recorded in the Hong Kong Observatory chart. Captured images that displayed the fine structure most prominently were selected. The lightning spectra fine structure is easily seen in the density of horizontal lines showing in the selected waterfalls.
The observations can be analyzed as a stochastic process, probability and random variables, expectations, moments, characteristic function and multi-variate distributions found in the book by J.M. Wozencraft and I.M. Jacobs [2].
References
[1] EE501: An Introduction to the Theory of Statistical Communications http://drolet.segfaults.net/EE501/index.html
[2] J.M. Wozencraft, I.M. Jacobs, Principles of Communications Engineering, Waveland Press Inc.,U.S.A., 1965
Congratulations @jrmagnetics! You have completed the following achievement on the Steem blockchain and have been rewarded with new badge(s) :
You can view your badges on your Steem Board and compare to others on the Steem Ranking
If you no longer want to receive notifications, reply to this comment with the word
STOPVote for @Steemitboard as a witness to get one more award and increased upvotes!