GBPJPY INSTANT SELL SIGNAL (Live Forex Trade Setup)
So here is my first trade signal as promised - I did plan to send these from next week but I like this setup and I want to share it. I'm going to do my analysis breakdown first with charts and then I will go on to give my entry + stop loss information at the bottom.
but enough for you to understand why I am taking my position
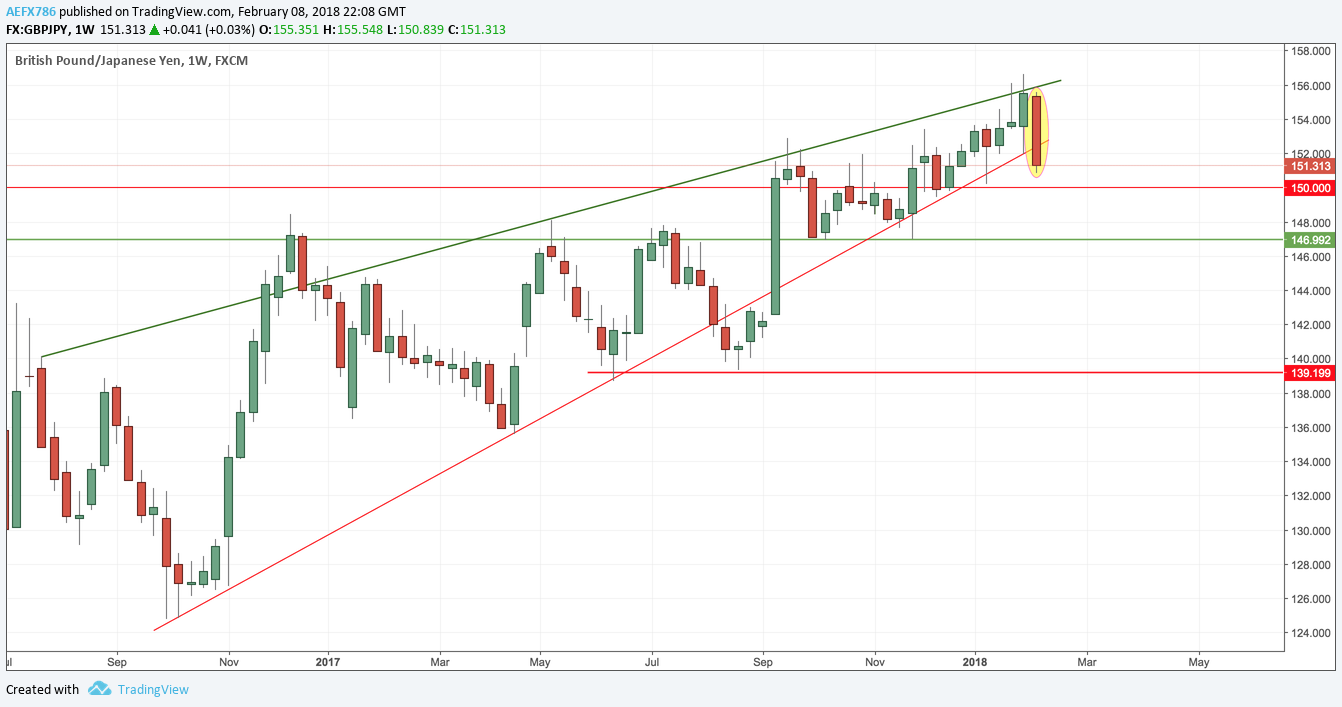
Weekly Timeframe Breakdown
On the weekly timeframe you can clearly see the Ascending Wedge pattern that I have been trading from late 2016, selling the highs and buying the lows. We've had some false breakouts but they were too early and not enough compression for price to break out and stay out. However, they give us nice target points where we can set out to take profits providing price can fall to those levels.It is likely the weekly candle will close bearish and providing we can close below the break and below the 152.000 even-number psychological support level, it leads way for further lows.
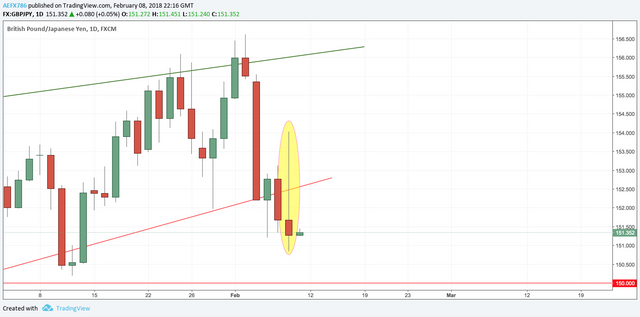
Daily Timeframe Breakdown
When you have a break of a strong level or a channel, it is likely price will go back to test that level. Yesterday price made a break and close below the ascending wedge channel, a channel in which price has been trading in since mid-2016.Today we have seen the price move back up to retest the ascending wedge channel as resistance and it did break through in the day - although I am not a fundamental trader, I will comment that the high wick is due to the BoE interest rate news which came today. However, you can see that price was unable to sustain the high and a few hours later it fell back down below the ascending wedge, which clearly shows a rejection of higher levels and again opens the doors price to move lower into next week.
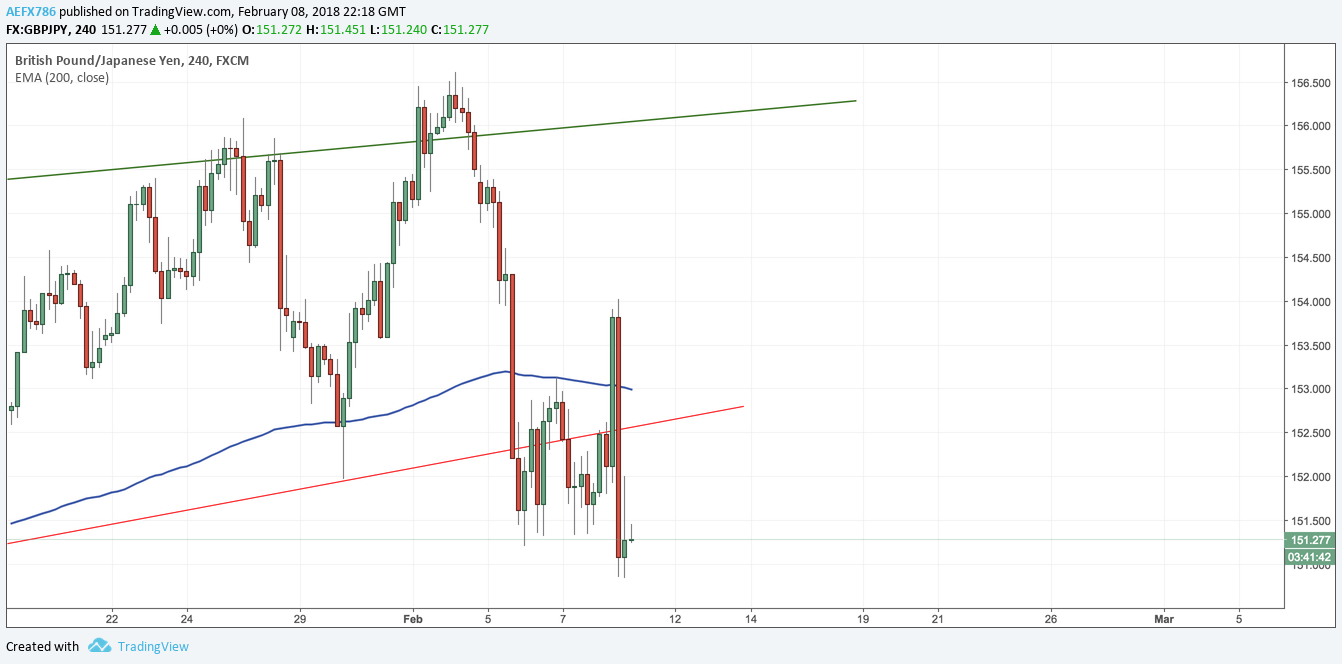
4-Hour (H4) Timeframe Breakdown
On the 4-Hour we can see that after price closed below the ascending wedge, we had a few days where the price started ranging and this is normal price behavior to sustain those levels before another leg down. Notice instead of breaking to the downside, the price moved up with a long bullish candle (BoE Interest Rate News) and following that, a clear bearish candle to drive price right back down and then break to the downside, below the range support level.The following candle retested that range which was previously support (now resistance) and formed a long wick above the green body. This shows clear rejection of the higher level and again, gives us confluence to look for a deeper drop towards lower levels.
1-Hour (H1) Timeframe Breakdown
I don't usually look at the H1 timeframe much but I just want to show in a clearer view the range that we have had over the last few days and also the shelf level that price has retested after failing to sustain the gains from the BoE interest rate news today.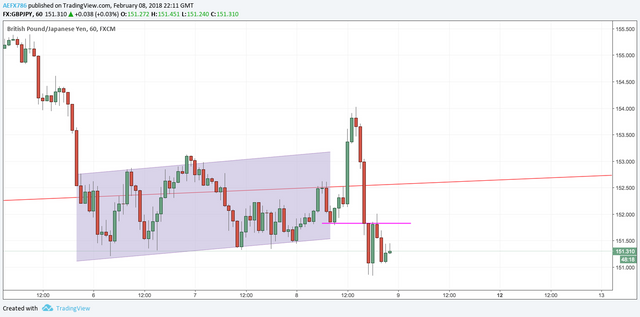
Take Profit Target Levels
Your first key level will be the 150.00 even-number psychological support level. You can look to take profit here. After this, the next level at which we would look to take profit would be the 147.00 support level and finally, our last key level will be the 139.200 support level. The daily timeframe screenshot below will show I have marked out these levels and you can see how price has historically reacted off these levels.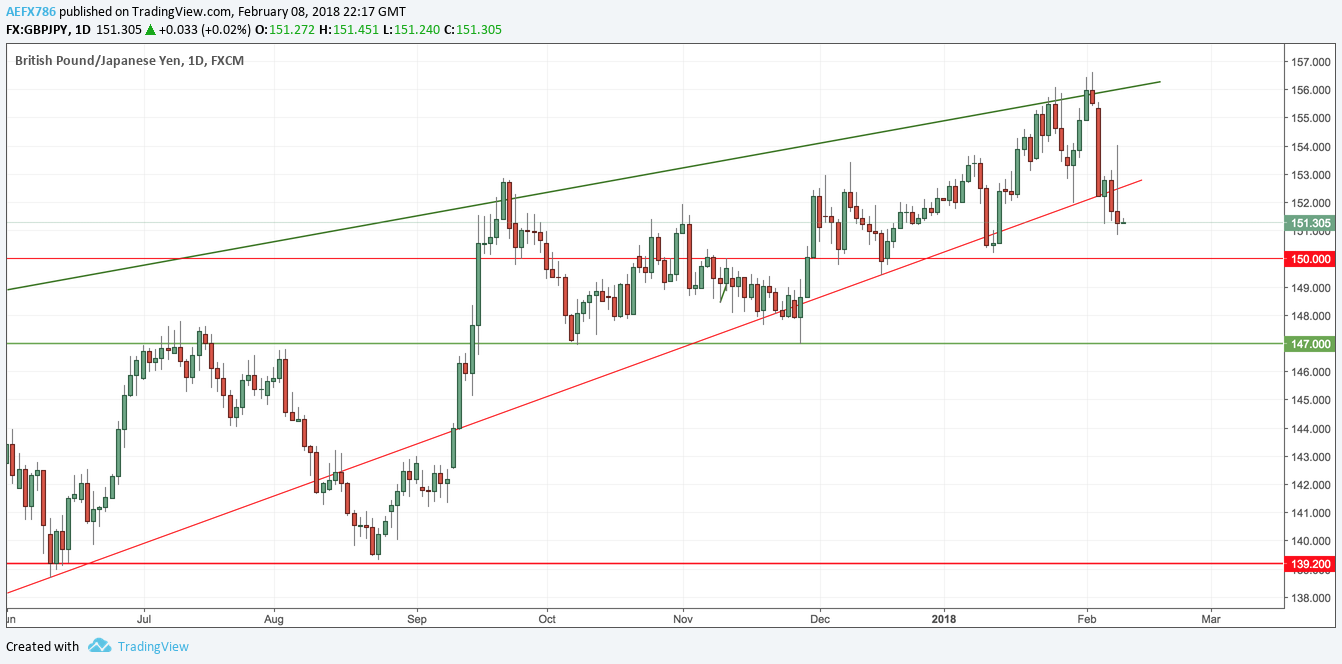
SELL GBPJPY SIGNAL
Entry Price: 151.500
Stop Loss: 154.180
This research is for informational purposes and should not be construed as personal advice. Trading any financial market involves risk. Trading on leverage involves risk of losses greater than deposits.
Who's In: @stepanh
If you wish to be notified on future trade setups, simply comment "I'm In!" and I'll tag you on my future signals.
Update:
I have taken a second sell position from 152.500 and if we drop back to my original entry, I may decide to close original position.
So as my earlier update this morning, we took a second entry from 152.500 and for the first entry, placed our Take Profit to entry point, so that the position will close at break-even when it reaches the entry price.
The market has accelerated to the downside, closing our original entry and we are now in +170 pips profit on this one position we have open.
Our first target of 150.00 has now been achieved and we are now +240 pips in profit. I'm not looking to close my position out here but you can take profit from here if you wish.
Price hit our first target of 150.000 and the market pulled back as expected. The price found resistance at the 151.000 level and below is a screenshot of lower timeframe, giving us opportunity to add to our position.
Note: If you are stacking positions, please keep an eye on it, you don't want price turning and all your positions hitting stop losses.
I have closed both my positions for a total of +378 pips. If I see another entry, I will jump back in - otherwise, I will wait until market opens Sunday/Monday.
Trading strategies rely on identifying price trends. Trend lines help traders see the direction of price movements. Brokerages like those broker here offer tools to help draw these lines and implement trading strategies. Trend lines can move up, down, or sideways, and they are a key part of analyzing price charts.