Let me Explain trading with Technical Analyses using Fibonacci Levels. Support and Resistance lines are Buy and Sell orders!
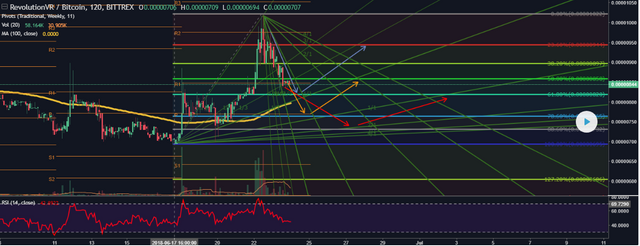
RVR Technical Analyse Gann support and Fibonacci levels by Kurd0w on TradingView.com
Wait for Good moment to Buy.
A good buy moment are these Arrows on the chart on Tradingview.com
The Arrows indicate buy and sell orders at those levels
First the blue one
Than the orange arrow
And the red arrow at last opportunity.
Buy between 700 and 720 satoshi
Stoploss at max 20% between 600 and 640 sat
Targets 775, 815, 880, 960, 1010
Join Telegram Channel: https://t.me/cryptobullmarket
Join Instagram: https://instagram.com/alittlebitcoin.nl/
So Wait for the Bounce at 700 Sat and for the daily close above this price level.
But also Bitcoin movement is not really the best choice to enter this trade.
Hit play Button on Tradingview
RVR Technical Analyse Gann support and Fibonacci levels by Kurd0w on TradingView.com
Congratulations @omertality! You received a personal award!
You can view your badges on your Steem Board and compare to others on the Steem Ranking
Do not miss the last post from @steemitboard:
Vote for @Steemitboard as a witness to get one more award and increased upvotes!