BBMA Complete Setup In Balance Area, NZ Dollar Ready to Take Off
The NZ Dollar and Canadian Dollar currency pair has gone up without any significant obstacles during the past month. Currently the price of the NZD / CAD pair is entering the Sideway phase and forming a new equilibrium region. Where will the price move next? Consider the full explanation seen from the side of indicator BBMA OA and Supply And Demand follows.
Analysis of Multi Time Frame BBMA OA
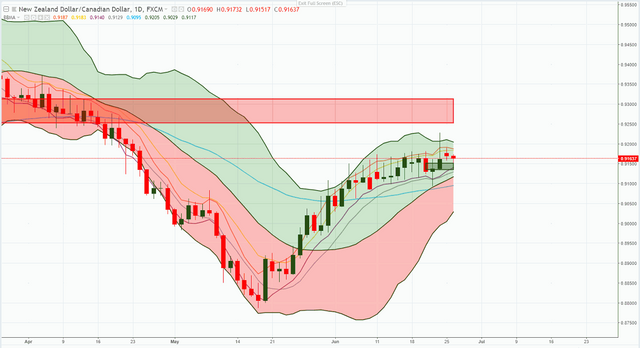
When viewed from the side of its Multi Time Frame analysis, on the 1-day time frame, the price has jumped up and formed the momentum about 22 days ago. This increase continues and establishes a new balance zone in the 1-day time frame. Most likely the price will find the right zone to form its Reentry signal to continue its journey up
Time Frame 4-Hour Analysis: Reentry Post Buy Momentum
At 4-hour time frame the price movement looks more volatile. A week ago there was an Extrem Buy process on Low BB. Extrem Buy is directly followed by a Buy CSAK that broke through Mid BB, MA-5 and 10 High simultaneously. This penetration is also followed by Reentry CSAK process and RBR Supply Zone establishment in 4-hour time frame.
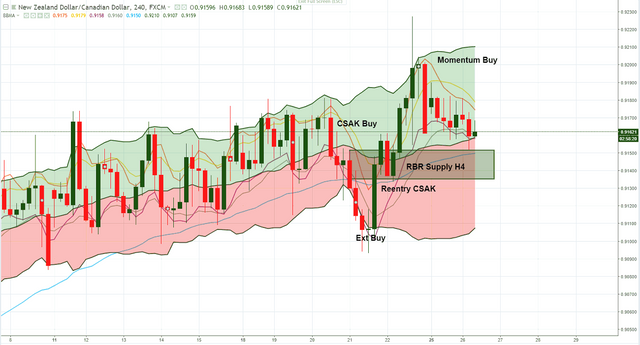
If observed, the current price is trying to find a good zone to form the process of Reentry after the occurrence of Buy Momentum. The process of forming this Reentry should be analyzed more deeply by looking at the pattern of price movements on the 1-hour and 15-minute time frame.
Time Frame 1-Hour Analysis: Extreme Buy At Low BB
At a 1-hour time frame, the current price has completed its Extrem Buy signal by searching for Mandatory TP in MA-5 High. Most likely the price will again try to go down then followed by the MHV process. The price can also move directly upward without doing Retest first.
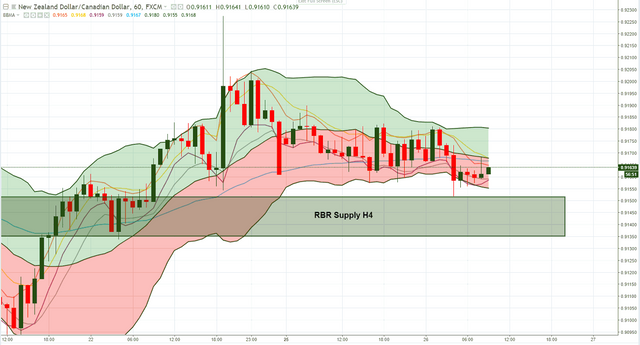
When viewed from the side of Supply And Demand it, the current price is in the zone Demand time frame 1-hour. In this zone the price is 3 times in the Reject. Reject in the Demand zone also coincides with the formation of Extreme Buy on the indicator of BBMA OA. For Reentry H4 validation then at 1-hour time frame, must be formed Extrem signal first.
Time Frame 15-minute Analysis: Complete Setup of BBMA
The last validation can be seen from the 15-minute time frame. At this time frame, it is necessary to setup Extrem or MHV to Reentry at 4-hour time frame to be valid. To be more secure, better still if waiting for the complete Setup BBMA.
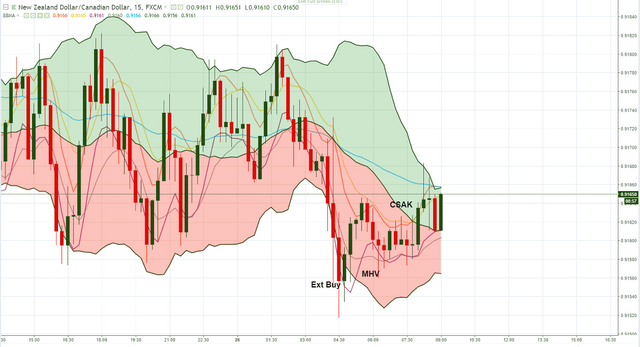
If observed at this time, the price in the NZD / CAD pair has formed a Complete Setup of BBMA at its 15-minute time frame. This Complete Setup is marked by the appearance of Extrem-MHV-CSAK-Reentry signals respectively. The establishment of Complete Setup is a sign that there is a high enough Buy opportunity in this currency pair.
Position Opening Advice
Signal: Long Buy
From the above explanations, it is concluded to focus on finding Buy positions on NZD / CAD pair.
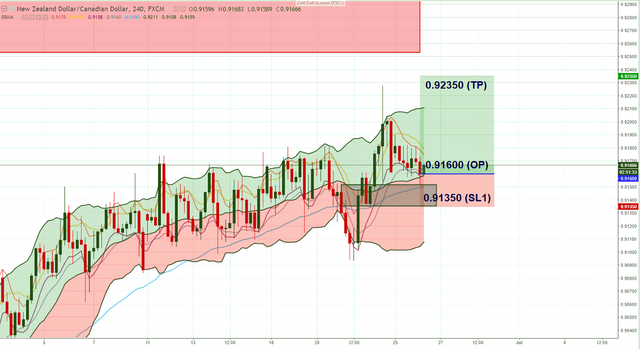
Entry: 0.91600
For Entry, you can install pending orders at the suggested level. For you an aggressive trader, you can also directly enter the current market. Of course with a slightly larger risk, but the possibility to miss the smaller train.
For those traders who want to look for safer opportunities, it's best to wait until Momentum Buy occurs at 15-minute time frame, then go to MA-5 / MA-10 Low.
Stop Loss: 0.91350 (25 pips)
Stop Loss is set at level 0.91350 as far as 25 pips. This level is chosen as the limit of loss due to its position as a 4-hour Demand time frame.
Take Profit: 0.92350 (75 pips)
The recommended take profit here comes from a 1: 3 RR calculation. With SL as far as 25 pips then set Take Profit level taken should be 3 times farther from SL. Found level 0.92350 as far as 75 pips for Take Profit level.
Estimated Trading Time: 1-2 Days
DISCLAIMER ON : In this analysis, any profits and losses become part of personal trading risk. I as the author is not entitled to receive any profit from you nor responsible for the loss that occurred. For that, it is always recommended to use a good and strict Money Management calculation . I myself only use about 3-5% of the account equity for each position. You can also use the MM calculator to facilitate lot calculation. Do not forget to move SL to Breakeven Point to eliminate any risk of loss of capital that may occur.
This analysis is primarily based on trading system and indicator of BBMA OA combined with Supply And Demand granting . If you find it difficult to understand the material submitted because of unfamiliar terms, consider reading the BBA OA Setting Up Indicator Guide , the BBMA OA Multi Time Frame Analysis Guide , and the Supply And Demand Basic Trading Guide .
https://steemit.com/news/@bible.com/6h36cq