Top low cap gem: SmartCash, my chart analysis
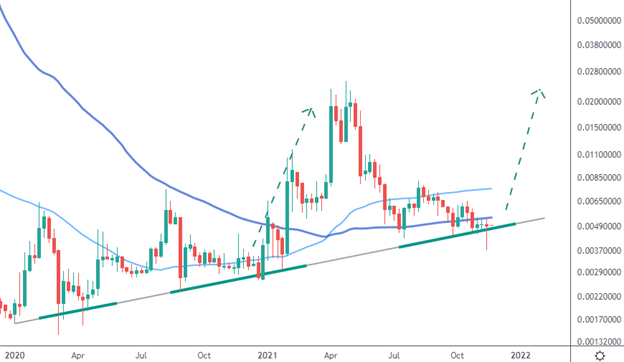
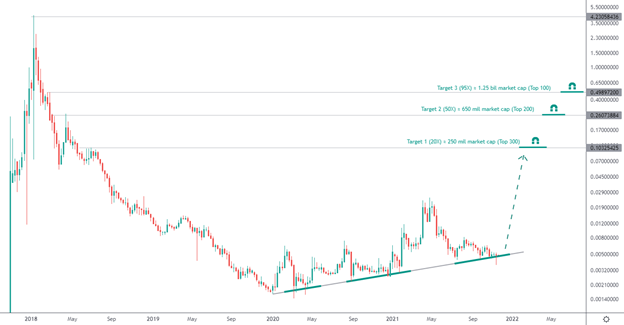
SMART/USD – Weekly chart
Strong weekly close confirms support of the long term upward moving trend-line for SmartCash. Preparing for shooting up similar to Jan 2021 (squeeze between MA100 and long-term support line, Jan2020 was a squeeze between MA50 and long-term support line). I am expecting a much larger jump now than the one seen from Jan-Apr (see argumentation below).
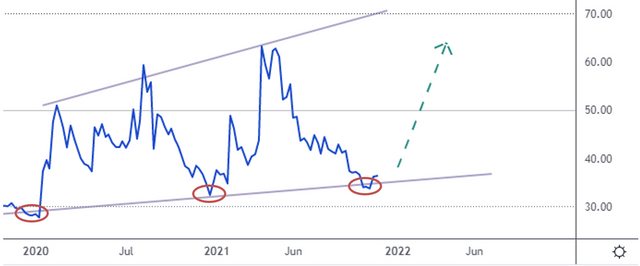
SMART/BTC - Weekly RSI levels
Bounce from trend-line providing potential for several weeks of strong upside momentum (see early 2020 and early 2021).
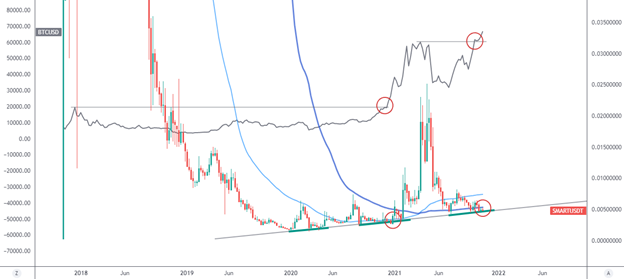
SMART/USD – Weekly chart – SMART vs BTC/USD chart
Also considering BTCUSD price we are in a similar situation to early 2021 when BTC was passing its ATH, and now BTC is passing its ATH again. Many would argue that we can see much more upside momentum for BTC/USD in the coming weeks toward end of this year and potentially also early next year.
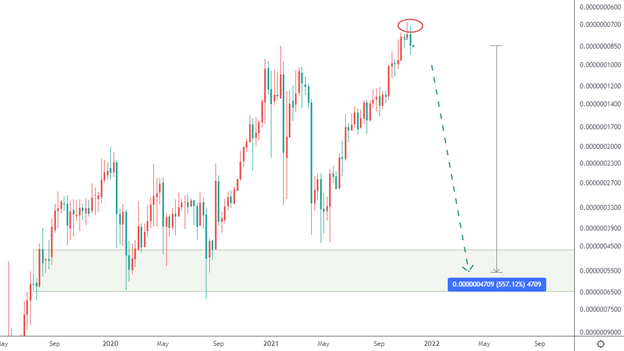
SMART/BTC – Inverted weekly chart
Strong weekly close with long wicks now 2 weeks in a row – bottom most likely found for SMART/BTC considering also RSI on daily and weekly timeframes.
SMART Distribution & Emission
Much of the SmartCash supply is removed from the liquid supply locked into smartrewards, smartnodes, termrewards and in other locked payments. 300 million smart were burned in the first time locked coin burn in crypto history (burned for 200 years). Additional regular coin burns are planned as additional deflationary measure.
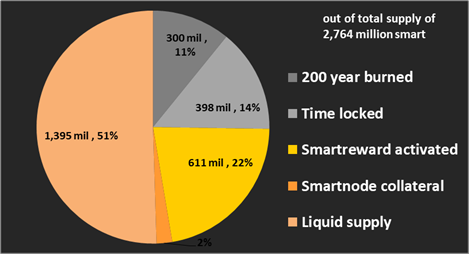
55% of SmartCash max supply has been mined to date. In the first 3 years of SmartCash already 50% of max supply was mined. This created a supply shock during the bear marked which resulting in the extremely sharp price drop from 2018 to 2020. Now it will take another 120years to mine the remaining 45%. Meaning, we will see scarcity of SmartCash kick-in with less and less $Smart mined while having a large portion (~50%) of SmartCash locked / removed from liquid circulation as shown above. See further details on the SmartCash emission curve here.
Key Project Fundamentals
SmartCash is starting to embrace the NFT space, and already is providing secure onchain DeFi functionalities with competitive APY. Major cost cutting initiatives were carried out during the 2018-2020 bear market and new developments continue such as the first encrypted chat function using blockchain technology. SmartCash early on focused on & implemented SmartMining an eco friendly mining approach. It offers instant transactions run over the distributed smartnode network and provide extremely low transaction fees. 3rd party vendors are preferably paid with time locked payments ensuring vendors have interest in supporting price deflation. The block rewards are fully distributed to the SmartCash community (via smartrewards, smartnode rewards and mining rewards).
SMART/USD – My Price target
With ~ 13 million market cap the SmartCash is ranked 1200 on coincecko, making it a very low market cap project. I believe it is massively undervalued in current 2.5 trillion USD crypto space. I see a 20X move for SmartCash quite likely with the information stated above. A 20X would bring SmartCash to a market cap of ~250 million (meaning just into the top 300 cryptos) and a price/$Smart of 10 cents. Once up in that region, there is not much resistance to reach 50X and 95X, however I would much expect an initial rejection around 10cent. The move up will be fueled by SMART/BTC price recovery (>9X) and BTC blasting to a new alt time high (>3X).
The above is just my own opinion after researching for an extensive period of time. SmartCash is the top low cap alt in my crypto portfolio. This is not financial advice.