It may take us 15 years to restore the stock market!
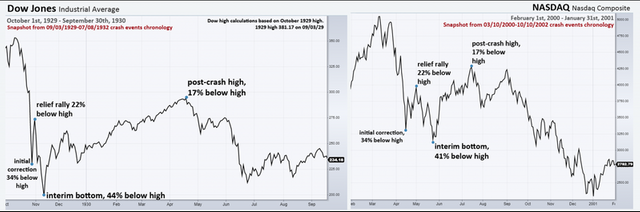
The graphs above show an almost identical chronology of events that occurred after the collapse of the Dow Jones in 1929 and the NASDAQ dotcom bubble explosion in 2000. The path to the bottom took Dow 32 months, and NASDAQ-31 month. The NASDAQ index fell 78%, and the Dow index 89% from its highs.
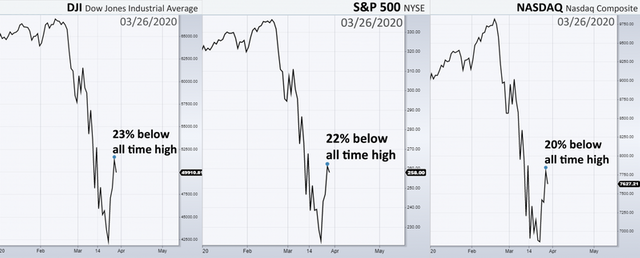
Charts of the Dow Jones, S&P 500 and US NASDAQ indices, showing the chronology of their collapse from February 20 to March 27. The chronology of the 2020 crashes and the Dow and NASDAQ crashes of 1929 and 2000, although their initial periods of correction and relief of the rally are very similar.
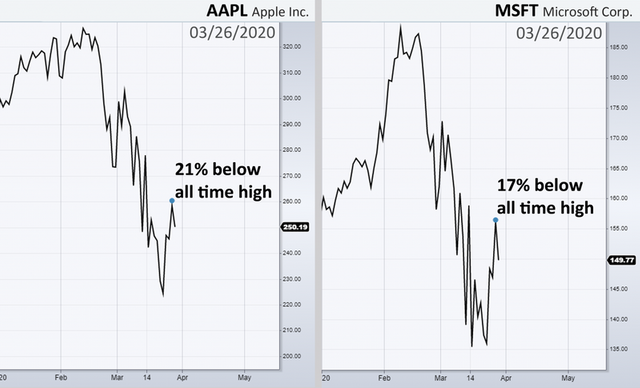
Models for Microsoft and Apple mimic three US indexes.
Further developments on the market.
New lows.
Intermediate bottoms.
Intermediate highs.
The final bottom in the fourth quarter of 2022 with a decrease in the range from 78% to 89% below the highs of 2020.
After the post-crisis maximum occurs, the indices will then reverse and begin to fall to the final bottom, which will be 79% below its 2020 highs.
The virus did not cause. This caused a correction for markets that are ripe for a market crash.
Intermediate bottom until May 4, 2020.
With an intermediate day, the market will be 41% - 44% below the 2020 highs.
The post-crisis maximum before the start of the path to the final day, the fourth quarter of 2022 will occur by June 24, 2020 and by the end of September 18, 2020.
The damage done to the markets and economies of the leading developed countries of the world will be much more serious than the damage caused by the crash of 1929.
It will take a minimum of 15 years for the market to return above the highs reached in March 2020.