A possible outline for the first big short against the S&P500
The S&P500 has been one of the best performing American indexes since the financial crisis 10 years ago.
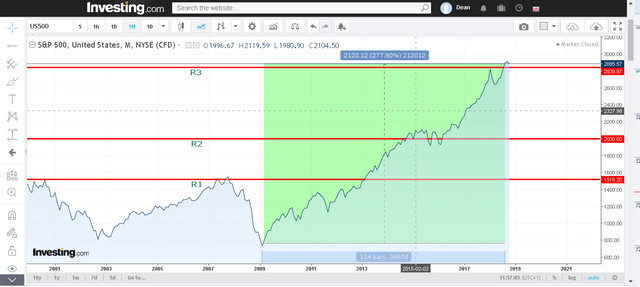
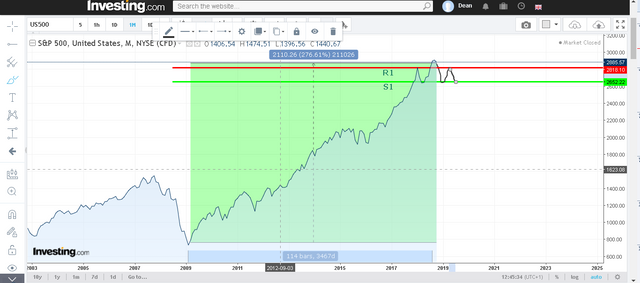
The 50 year chart shows the bull run in graphic detail.
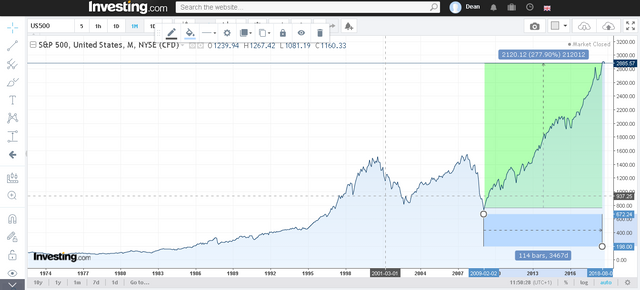
In a little under 10 years (3467 days to be precise) the S&P500 has gained a little under 300% and surpassed it's previous all-time high by over 50%.
Now many analysts predicted the S&P500 would basically go into correction at the previous all-time high point purely because it has done in the past. However I consider this a misconception.
The reason the S&P500 did not crash here is because A) the markets are being driven by forces other than grassroots buying and selling B) the markets are not in-themselves sentient entities which pin down nice tidy points to crash.
We cannot treat the markets as rational entities which will crash at nice neat tidy predetermined points on the price index. Only investor sentiment can crash the markets and ultimately, there was not enough negative sentiment and selling pressure to take out the rally at the 2000 mark. The fundamentals did not support a crash and thus there was no reason for one to occur.
The 2nd main point where the S&P500 faltered was the 2000 mark. Again, many analysts predicted pullback here however, the rally continued with the S&P500 avoiding a crash and gaining another 800 USD.
Lets map these points onto a chart.
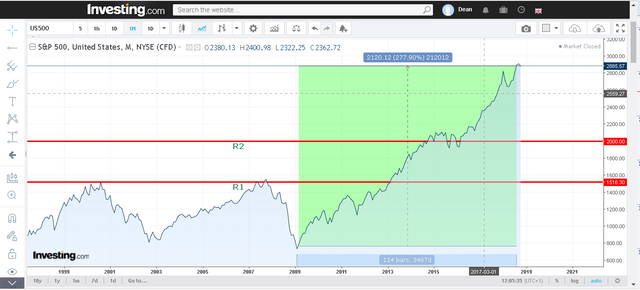
Now if we look at the previous move past the all-time high, it faltered around the R2 mark at the 2000 price point and experienced a dip and then a failed rally and then a 2nd dip before the rally succeeded and broke out to the current rally towards the 3000 mark.
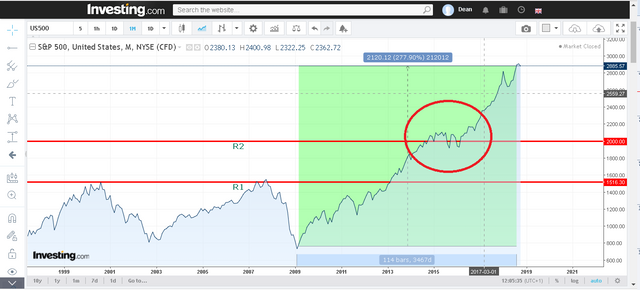
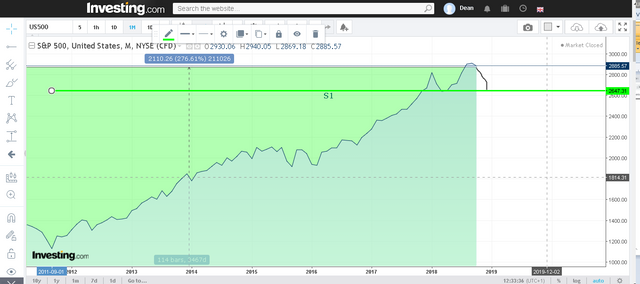
This interested me at the time because it seemed to be forming a bearish pattern of failed rallies that chart analysts would typically view as a Head & Shoulders formation (information here https://www.investopedia.com/terms/h/head-shoulders.asp)
However, before the S&P500 could complete the pattern (Which would require another failed rally) the index rallied through the 2000 point bringing us neatly to our current position in the chart.
Now again we're at a similar place in the market with the S&P500 experiencing a dip and, more interestingly, the current rally is showing signs of stalling
Now this is interesting to me because we might seeing the start of a possible Head & Shoulders formation on the long term macrotrend.
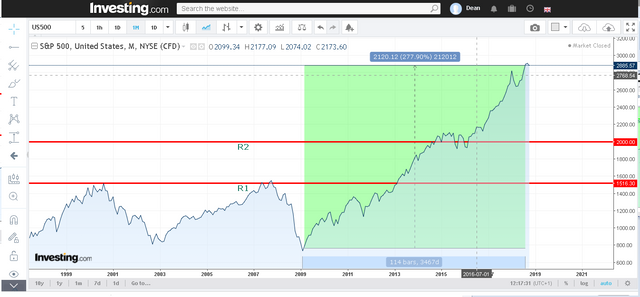
Lets do some projections.
Firstly, the most obvious near-term support is a point which sits at around the 2650 mark.
This doesn't seem so grevious right? Well actually, the problem with this is that it actually deepens the risk of the S&P500 forming a bearish pattern on the long-term chart.
The reason for this is that it would need just one more failed rally to form the third peak of a head & shoulders formation.
A primary support point sits a short distance away at 2850
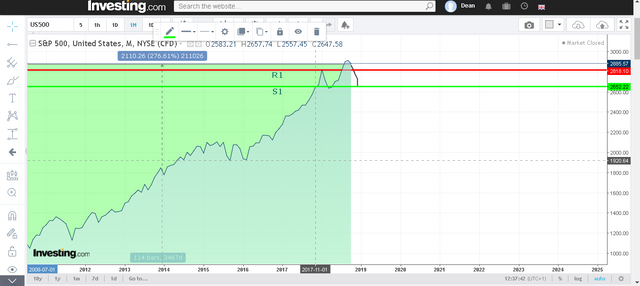
And so a rally at this point would add further definition to the Head & Shoulders formation and would soon enough run into near-term resistance at R1
Now we can obviously see where this is going. If the S&P500 does not break through and reach 3000 then it risks forming a completed Head & Shoulders pattern which is a serious bearish signal for this index.
The play I am considering therefore can be outlined as follows:

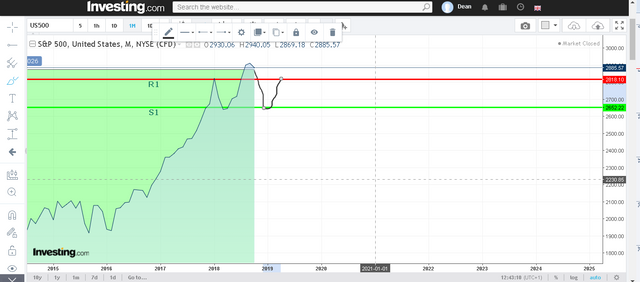
Firstly, we need to wait for the current rally to stall (which I believe it will) and correct down to a point around the 2650 mark.
Secondly, the rally which follows must be monitored for it's health as the next rally will take us up to our entry position at around 2800.
Thirdly, since the S&P500 must break 3000 to defeat the bearish Head & Shoulder pattern, we put our stop loss a little before this mark at around 2920 give or take a few dollars.
Fourthly, aim to enter the market and open a short on the apex point of the third peak of the Head & Shoulder pattern around the 2800 mark.
Place take-profit a little below the 2100 mark around 2080. IMPORTANT! This is where the market must be monitored carefully as there is ZERO DATA to suggest whether the S&P500 will have enough selling power in a decline to breach the support which will have cemented around the previous all-time-high. If it does not, then the short outlined above will take 20-25% unleveraged. Iff it does, then we can look to 2 other possible support points for the end of our short position.
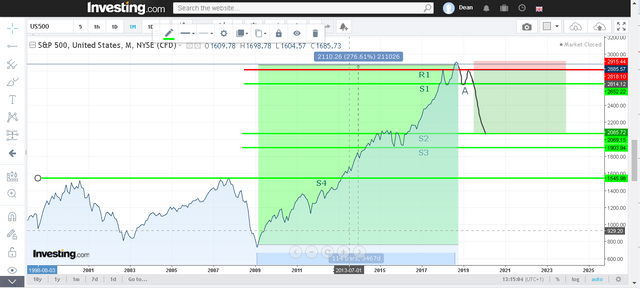
S3 is the bottom of the dips during the selloff which occurred late 2015/early 2016.
S4 is the previous all-time-high.
These would take 30% and 45% respectively without leverage and this outlines the opportunity here.
If this is simply a correction down to the 2080 mark, then this is a good opportunity HOWEVER... the broader opportunity is of course the possibility of a real bear market forming which would significantly extend the S&P500's losses and of course vastly extend the profit of a short against it.
So to summarise, watch and wait. Opportunity and patience go hand-in-hand here.