A look at SBD dynamics
Following a drop in the daily SBD payouts, I thought it would be interesting to take a closer look at the SBD production and conversion dynamics since it started.
Our first two charts highlight the SBD production and conversions since the first SBD payout that was made on the 4th of July, We can see that the SBD issued for authors reward clearly follows the Steem price moving pattern, the payout was higher when Steem price reached its current ATH and then started dropping as the price started to correct to the downside.
The charts also show that conversion have been active since the early days, conversion is a good way to sell SBD for Steem without impacting the SBD market much, and it’s especially effective for large orders as it allows the seller to get $1 worth of Steem/SBD (based on 7 days median price), which is not possible now in the SBD/BTC market. Of course there is a risk of loss in the conversion if the price drops much in the last day or two before the payout is due, but it’s still the preferred method for many to sell SBD as we can see. We also can see that last week had record conversion orders made with almost 200k SBD conversion planned in the next 7 days as we will see in the last chart.
We can also see that the total issued SBD was about 3 322 509.077 of which 1 107 248.859 was converted to Steem which leaves us with a total of liquid SBD of 2 215 260.218 as of this report's date
*(conversions are accounted for upon conversion request and not upon filling since the request cannot be reverted)
Daily SBD production chart:
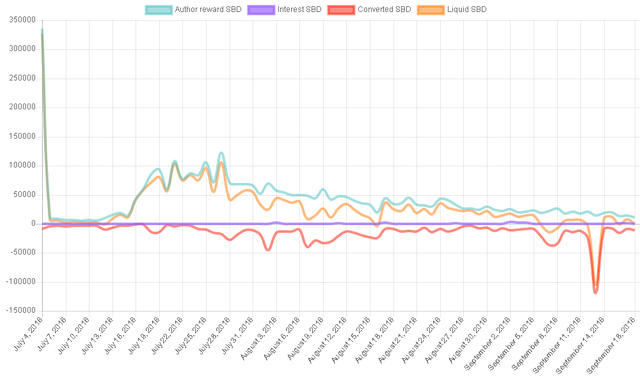
| SBD Type | Min | Max | Average |
|---|---|---|---|
| Author reward | 5 229.798 | 335 588.866 | 42 876.469 |
| Interest | 0.520 | 3 152.950 | 273.000 |
| Conversion | -119 398.213 | -630.889 | -14 379.855 |
| Liquid | -104 540.081 | 326 812.256 | 28 769.613 |
Daily SBD production chart (cumulated):
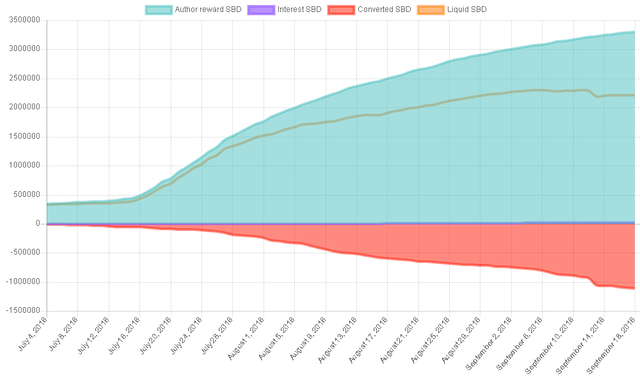
| SBD Type | Total |
|---|---|
| Author reward | 3 301 488.091 |
| Interest | 21 020.986 |
| Conversion | -1 107 248.859 |
| Liquid | 2 215 260.218 |
In our next chart we take a closer look at the SBD interests that were paid, as the previous charts do not show it clearly, we can see that many Steemians are collecting SBD interest which is indeed is one of the reasons that encourage holding SBD for the long term.
Daily SBD interest payout chart:
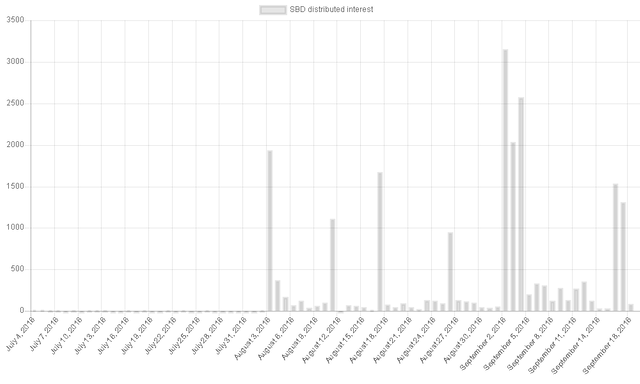
| Interest | |
|---|---|
| Min | 0.520 |
| Max | 3 152.950 |
| Average | 273.000 |
The following chart shows the evolution of the SBD/Steem ratio.
Daily SBD/Steem ratio:
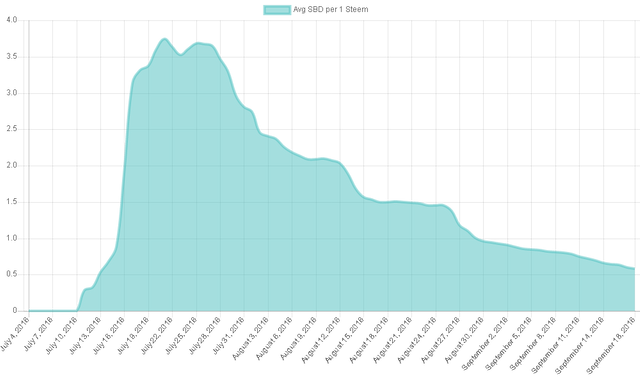
| SBD/Steem | |
|---|---|
| Min | 0.280 |
| Max | 3.743 |
| Average | 1.602 |
Our last chart highlights the conversions set to be filled in the next 7 days, we can see that a record 197 948.995 SBD were requested to be converted, which is about 8% of the current liquid SBD (about 2.4 millions not accounting the unfilled conversion). It will definitely be interesting to see what impact such a huge conversion will have on the SBD and Steem markets, and also on the SP of the accounts.
Daily SBD next week's "to be filled" conversions:
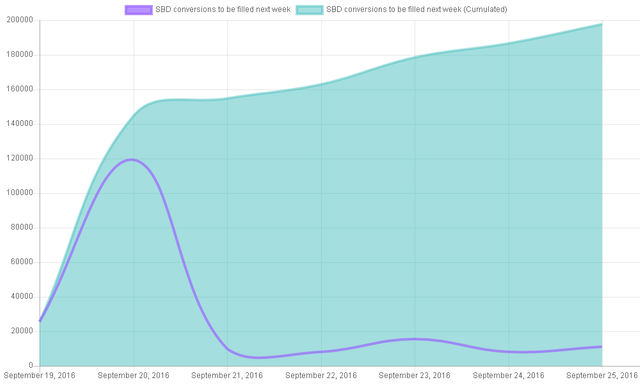
| Next week conversions | |
|---|---|
| Min | 8 040.210 |
| Max | 119 398.213 |
| Average | 28 278.428 |
| Total | 197 948.995 |
In conclusion, we can see that SBD is a key component of the Steem ecosystem, as it impacts payouts, price and SP. It also has some unique features as its market cap that can increase or decrease depending on the emission and conversion. SBD definitely offers opportunities to make profit so use your SBD wisely.
This report covers SBD operations made between:
July 4, 2016, 12:00 am UTC and September 18, 2016, 11:59 pm UTC
because of today's peg correction, how this will affect people who decided convert those 200k? Knowing that such correction would be made, was it a good or bad decision to start conversion?
Reducing the feed means the conversions will receive a higher amount of STEEM, all else being equal. The amount is a 7-day trailing median, so for those happening in the next few days, most of that window is already baked in and not affected by the reduced feed prices.
BTW, the enormous conversion (at least one anyway, I didn't look that carefully to see if there are others) of 100K was performed by steemit2 account, owned by Steemit Inc, which currently holds over 5.5 million liquid STEEM. The amount received as a result of the conversion, about 200K liquid STEEM, will not make a whole lot of difference to their overall liquid STEEM holdings. I would guess they did it specifically to reduce the supply of SBD both to help support the peg and to help align with the upcoming SBD stability changes, although I have no first hand knowledge of their motivations.
Thanks for your input @smooth, always appreciated!
I think it's a good decision regardless, because the amount is huge, it cannot be sold on the regular market.
Thanks for the review, I was looking forward to read about this in the hours following the forking... Namaste :)
Good data. But, no total supply chart?
Total supply is in the second chart: cumulated liquid SBD, it’s 2 215 260.218 (unfilled conversions included)
Thanks. I didn't know "liquid" is "supply".
Nice work @masteryoda. Thanks, this is really interesting.
The new dynamics between brands and consumers, driven by social media, are proving to be a powerful impetus for change.
Thank you for doing this! I have wondered the same as well.
Since the new feature where authors can chose to be paid in SP only came out, do you see a smaller number of SBD's leaving the platform?
Fantastic charts! Thank you for delving deeper into the analysis of SBD, it is greatly appreciated.
A loyal follower of your charts and analysis,
Steem on,
Mike
Thank you for your support.
Very nice!
fantastic work .......... great analysis report :)
Good work @masteryoda. Thanks, this is interesting. :)