STEEM DOLLAR Technical Analysis Update (SBD/USD): Bullish Cup and Handle Spotted on chart, Sharp rise expected in SBD
Analysis Summary:
Hi friend welcome to this first time analysis of SBD/USD. I have decided to add SBD to my daily technical analysis update posts from now on. I will post regular updates for any interesting development in the SBD chart with my regular posts.
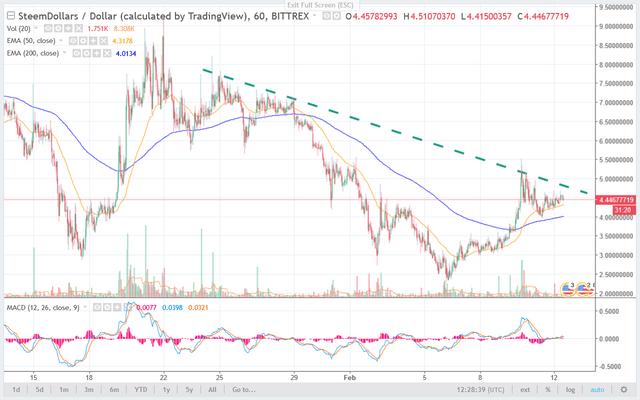
Looking at the hourly chart we can see that SBD is currently trading just above EMA50 (orange). This level has so far acted as excellent support. This strength of this support is increase due to the EMA200 (blue) just below it; you can see that a fall below the EMA50 was bounced of EMA200.
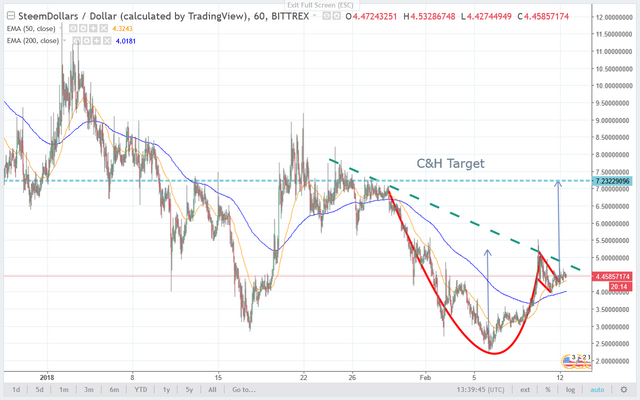
further wee can see that SBD has formed a cup and handle sort of pattern that i have drawn in red on the hourly chart, this structure is giving us a target around $7.5. As you can see hat breakout from this pattern has already occurred, and so far SBD is moving upward as expected after this pattern. I have drawn the target for C&H is blue dotted lines on the chart. how long it will take to reach there that is another question which i will try to answer from 4 hour chart later in this post.
So far based on this chart we can say that there is some good support for checking any fall, but how about upward resistances, if you will look closely I have drawn a downward trend line on this chart, the trend line is going to act as some resistance for SBD but this line is the last point defining the downward trend. A breach above this line significantly can bring SBD back in the uptrend and a rise to higher highs can be expected from there.
Let’s have a look at the 4 hour chart to see how SBD is behaving there in order to get our answer, when SBD will reach our given target and what are the restrictions that will come in its way upward.
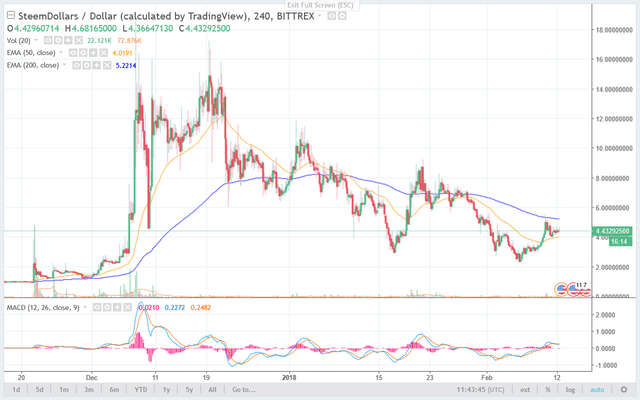
Looking at the chart we can see that here SBD is trading just above EMA50 (orange) and EMA200 (blue) is restricting any upward journey so far, it is very crucial for SBD to break above EMA200 in this chart in order to be free in its upward journey. If SBD manages to break above this level then a sharp rise till levels around $8 is expected breaching the last high achieved in January.
MACD and volume on both the charts are so far looks ok for a bullish outcome; I must admit the hourly chart of SBD is the only chart where a bullish crossover between EMA50 and 200 has already taken place and the wedge between both these EMA is also on expansion, that is some good bullish signal and SBD can be expected to break free from this downtrend market soon and before any other crypto asset out there, Based on these evidences I am expecting to see levels above $8 very soon in future.
However I would like to add that a fall in BTC hampers all the growth expectations of any altcoin, including the SBD. so keep your eyes on the BTC chart as well for gauging the overall sentiment in the market.
That will all from me for the time being, I will keep you guys updated if there are some interesting developments in the chart.
Till then Good Bye and Best of luck to you People.
1.98% @pushup from @ajai