The only trend I care about:
Go to CoinMarketCap (https://coinmarketcap.com), select “Tools”, click on “Global Charts”, scroll down to “Percentage of Total Market Capitalization (Dominance)” and then deselect all the options except for “Others” and you’ll come up with this:
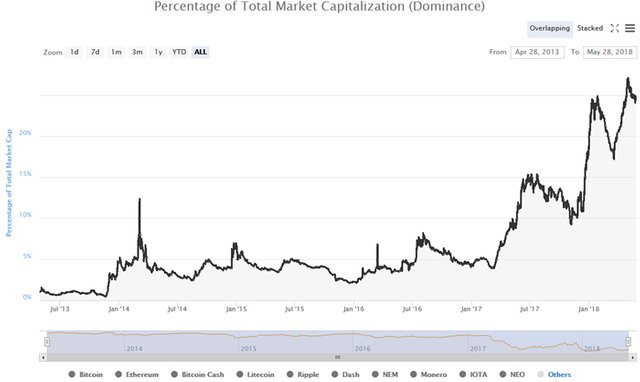
That’s the picture of a strong upward trend that includes all other Alts that are not in the group you just deselected, and is exactly where I want to be putting my speculative investments to work. Of course, it goes without saying that STEEM, BitShares, ADA, Syscoin and ARK are an important part of that group. 😎
Read the "The Dos and Don’ts" here if you're not aware of my rules.
This is also an indicator that I have been watching for some time as well. However, I am trying to filter it a bit as the Other category is somewhat biased to the upside as it includes all new coins that get listed. Given the increase in ICOs towards the end of 2017 and the beginning of 2018, these figures do not necessarily represent an increase in value of these assets but instead an increase in the quantity of assets in the cryptocurrency space. This will soon start to normalize as ICO activity has come down a bit and a lot of 2017 ICOs will fail ultimately. However, I do like the list of assets you have there as being the few that will succeed.
Yeah, we really are dealing with very raw data, but the aggregate is there none-the-less. As always, it's important to keep the source in mind. On the other hand, I think I can see the influence of EOS on that chart. 😉
yeah agree with you
That’s why I recently added to my portfolio EOS (@$10.77), BTS (@$0.19) and Bitcoin (@$7,550.00). This is our opportunity in a lifetime. These are great prices on sale with a additional discount. For some people these are really frustrating times, I hope most of us will take advantage of this opportunity. This sell off allowed me to lower me average prices by a lot. Now it has to go just a bit higher for some of my trades to be finally profitable. Other already are. If we go lower, I will buy even more. We were expecting this since we saw formation of right shoulder of reversed H&S. Even ETH had small H&S and recently broke, which took us very quickly to this level. I expect market to go a bit lower since it behaves still weak. But that’s fine, your chart only proofs it’s a healthy correction. This time it’s not different!!!
And now there are possible double bottoms building across the board! In any event, a great place to scale in more buys. Wish I had more speculative capital, but my "bags" are already full.
In the end it always comes down to "Don't mess with the bull if you can't stand the horns" these red crypto markets are dumb and volatile, because most of the people are newbies and go out with losses instead of sitting tight and holding, and that makes the red markets worse, it will eventually even out again and we will return to business as usual, the sheeps can't take a bit of fud because they start dropping all their wool.
It's important to have a plan and stick with it. When dealing with speculative investments, the basis of that plan should be to invest only what you can afford to lose and then stick with it, even when there's blood in the street.
In fact, it's actually a good idea to add to your position when there's blood in the street!
If someone had showed me this chart and I wouldn’t have been invested in crypto at all, I would have told him “that’s no brainer, it’s perfect time to be buying”. Sometimes small kid can be a better investor than many of us. My point is most people think with too complicated way. Small kid would look at this chart and say “up”. But our emotions, just because it doesn’t go immediately the way we expect it to go, we panic and sell at the worst time. Instead this simply thinking small kid would be buying. When I learned how to buy stocks on brokerage account I started trading with paper money. With paper money there are no emotions involved. I made $20k in a month. I felt like I was billionaire already lol. When I started with real money, my emotions got involved and you can figure ou how that ended. My point is, just look at this graph the simple way with common sense. This is not downtrend, this is perfect uptrend!!!
Managing our emotions is a big part of successful investing/trading and one way to help do it is by trading/investing in appropriate size and being patient.
I 100% Agree!!!
We are humans! Sometimes it’s difficult to manage our emotions. We make mistakes and as long as we learn from them we should be fine.
As you mentioned “trading/investing in appropriate size and being patient” is the most successful strategy.
Thank you!
Have a great day!
Well brother, thanks for that! To be honest I didn't know that function.
But I have to admit that I love this line! It looks bullish not for a short term investment but alts have showed great progress especially over the last 16 months. And the fact that Steem, BTS, of of course one of my favorites (ZIL) belong in that trend makes me really optimistic.
Especially considering the last few days/weeks downfall.... Seems like a perfect point for investment.
PS. In that group, also belong some of the coins that will vanish... so everyone has to be careful!
Have a nice day @cryptographic
^^ That!
Nothing has changed since my previous update, price is still moving sideways.
Yesterday it looked like Bitcoin -3.37% was slipping and would make another drop but there were some buyers who pushed the price back into the triangle again. In one of my previous updates, i mentioned that i was thinking about 2 options. A bear flag , which would mean the price has to go towards 7700/7800 first and than drop again or that we just drop from that point on. Since then we have been moving up and down and making a bigger triangle (something it has done more often!). I remember from the last time (yellow cricle) i was short from the 8900 (don't remember exactly) and i closed around the 8000/8200 i think because i thought the price would make a correction. It dropped even more and during that 'yellow' phase i was waiting for 8200ish to go short again. There were several attempts to push higher but eventually it did not become a flag but a triangle. So i missed the whole ride down that time.
It's hard to short lows . . . but your pink zone might be interesting . . . if you're really convinced you've got a good risk/reward and you're disciplined with your stops.
I see crypto as a megabull. I wouldn't be caught shorting it for my life.
Thank you so much for your valuable time to reply to my comment.
It will really inspire me to analyze in the future and I am very happy to know your valuable feedback 😊
Hi 👋,
Sir, you are a tremendous trading analyser I'm publishing my personal trading opinion here.
What's up traders, I hope you're all having a good trading week.
Let's analyze LTC/USD on the 1D chart.
When looking at the 1 Day chart, price is clearly trading under a side-wards resistance line, since breaking down on the 6th -3.03% of May back into structure, looking like a bear trap type scenario. Price will now likely continue the down move into the horizontal support zone between 115 and 93, and this is evident from price action showing a mini flag pattern since 15th May implying a measure move target to the horizontal support zone .
Litecoin is also trading under major moving average resistance, and the 20 just crossed under the 50, and the 200 firmly above the 20 and the 50 respectively. This shows huge technical weakness in the downtrend.
Litecoin has a probability to go to the upside, however I believe price is going lower first before any bullish activity. If price goes lower than the horizontal support zone between 115 and 93.
Let's see how the market continues.
Happy trading guys ❤
It's trying to bounce off your upper support. Lots of similar patterns out there. Lots of inverted H&S too. This is a very logical place to look for a reversal. It's also a logical stop loss level for new entries on aggressive positions. Lastly, a simply fantastic place for long term investments, IMHO.
Sir, you are a very valuable analyzer and important personality For this community, you are continuously giving ideas about trade marketing and marking the problems present there and each member is very efficiently explaining each topic to thank you very much for presenting your valuable important points. I show you sincere honor!
Interesting chart. If comparing with Bitcoin, it shows when Bitcoin Mcap started to decline, 'Others' Mcap started to rise, which means, when Bitcoin price started dropping, not all proceeds from Bitcoin went to cash, some of it went to Others.
Another thing to note is, two, that are now among top 10 (EOS and Cardano) had quite a strong run up lately. But since they are not (yet) listed bellow, you can't check their influence in this "Others" rise chart. My guess would be EOS and Cardano contributed a lot to this Others chart rise.
One last thought, when BTC starts rising again and money start pouring toward it again, will money flow reverse and start moving from others back to BTC?!?
Very good analysis and a very good question. I think "Others" FOMO will keep a large majority camped in "Others". Moving out of quality crypto like STEEM, BitShares, EOS, Cardano, Syscoin, back into BTC would be a conservative trade that I personally wouldn't be able to justify, and my bet is that the market will show us that most of us are of like mind.
The break of the support line at 2.55$ is now confirmed. The next main resistance is at 2.00$ so we could drop quickly to this level. However, I suspect an imminent bounce on the BTC when we will touch the support line. This bounce could help us to stop the drop on the STEEM also and go back higher than 2.55$. Keep an eye on the BTC, if the drop continues, we will touch very quickly the 2$ levels
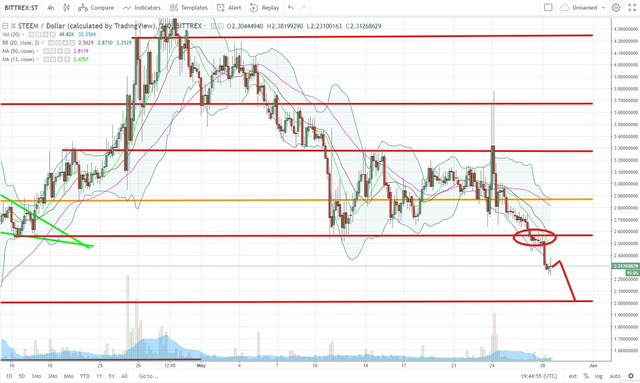
Hit $2.08 on Bittrex. Bouncing back above $2.43 now, trying to reach back into the $2.50-$2.75 breakdown level.
Always amazes me to see the bargain basement prices STEEM is capable of trading at!
Hey there, @cryptography its been a while, hope you are doing great. I love what you are doing.
I strongly agree with you on this note. Every smart crypto investor should know this by now, because come december the story wont be the same.
Thanks @cryptography